Data Visualization: Old Practice, New Value
Data visualization is not new.
During a recent International Institute for Analytics (IIA) webinar, Bill Franks, chief analytics officer for Teradata and author of several books including Taming the Big Data Tidal Wave and the forthcoming The Analytics Revolution, shared a visualization created in 1869 to illustrate Napolean's troop losses during his invasion of Russia in 1812. Those early visualizations required lots of manual labor to collect and then illustrate the data, chores performed by a data specialist.
Despite advancements through the years, visualization remained largely the purview of data specialists until visualization capabilities were added to desktop tools such as Microsoft Excel. Yet even using those tools, creating visualizations was a labor intensive process that involved lots of cutting, pasting and manual entry of data.
Today, however, modern tools make it easy to create robust data visualizations, Franks said, and to combine text with visuals so analytics can “tell a story.”
On the “outer edge” of data visualization, some companies are beginning to leverage technologies used for video gaming and other immersive experiences to produce compelling visualizations, he said, noting that Facebook purchased virtual reality headset maker Oculus in March.
Data Visualization Benefits
Unlike prior tools, today's data visualization tools make it easy to make changes – generally just by pointing and clicking – connect to multiple different types of data sources and share visualizations. “It’s easy to explore and pivot and go around and look at data. You can explore more questions, more deeply, than you could before,” Franks said.
Tools from such companies as SAS, Tableau, Tibco Spotfire, QlikView and MicroStrategy facilitate this kind of exploration, which can result in discovering trends and patterns that were difficult to identify before, Franks said.
He said these tools offer several “huge value propositions,” among them:
- Better visuals help bring data and analysis to life
- They support decision making rather than simply reporting what happened
- They democratize data with flexible, self-service environments
I wrote about the democratic data trend last week. I like how Franks described it during the webinar: “Users can analyze data as they see fit not as someone saw fit to allow them.”
How Data Discovery Is Like Yogurt
Franks described how a yogurt shop near his home, where a server dished up the yogurt and toppings, charging extra for each topping, had closed. It was replaced with a self-service store that allows consumers to mix and match flavors and toppings and pay for the product by weight. The shuttered store was “analogous to the traditional IT model of controlling and dispensing data to users as they see fit,” he said, while the newer store represents “a discovery model where IT enables users to explore data with everything from visualization tools to deep analytics tools.”
Just as consumers might help yogurt stores discover new flavors by experimenting with the existing ones, business users might help IT organizations discover new types of data analysis they want to put into production, Franks said.
“The central command-and-control environment cannot handle the load of the variety of analytics from the variety of people under the variety of methodologies that need to be applied. You have to allow users figure out how to do it on their own, then you can operationalize and harden the process,” he said.
Data Visualization Caveats
There are some caveats with data visualization tools, Franks said. It is easy to get carried away, he pointed out, advising folks to “remember that visualization is about having an impact and getting a point across, versus just using something because it is cool.”

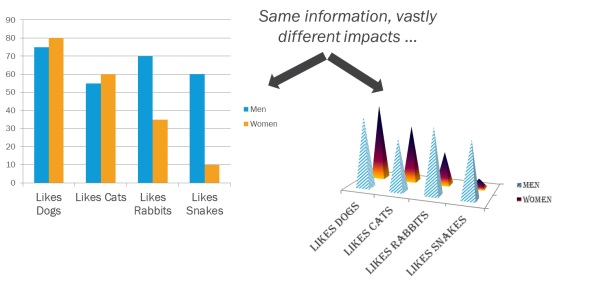
He presented examples of visualizations created using the same data sets, in which it was much easier to understand the information in visualizations that utilized a simple bar chart or pie chart instead of the ones that included 3D features and other fancy but distracting graphics.
While bar charts and pie graphs are broadly relevant, Franks said, “newer tools are not meant to be as broadly relevant or applicable” and thus are not appropriate for certain types of data. It takes some practice to determine which types of tools work best for different types of data.
Another example: A visualization showing a person connected to others in an organization with arrows is a great way to illustrate social or network connections. You could use a spreadsheet to present the same information, Franks said, but “it would be very difficult to understand the information the way you can with a visualization (that uses the arrows).”
“Always default to the simplest thing you can do to get your point across,” Franks advised. He also encouraged matching data visualizations to the audience you are targeting. So, for example, you might want to focus on distilling down key points for executives.
Perhaps most important, organizations must not view data visualization tools as “a magic bullet to solve problems,” Franks said.
“You are still going to have to implement something and operationalize data to get value from it. Once you have that ‘ah-ha' moment, you still have a lot of work to do from there to make it pay off for your organization. It's not just about acquiring data, it's not just analyzing it to get a discovery, it's making sure you can deploy it to different people in different ways and almost instantaneously.”
You can view the webinar at the IIA website.
Ann All is the editor of Enterprise Apps Today and eSecurity Planet. She has covered business and technology for more than a decade, writing about everything from business intelligence to virtualization.

Public relations, digital marketing, journalism, copywriting. I have done it all so I am able to communicate any information in a professional manner. Recent work includes creating compelling digital content, and applying SEO strategies to increase website performance. I am a skilled copy editor who can manage budgets and people.


