Power BI vs. Tableau: Business Intelligence (BI) Software Comparison
Page Contents
Business intelligence (BI) is critical to the success of modern enterprises, and BI tools are growing in prevalence.
Capable tools are needed to help businesses turn their business data into actionable insights.
Here, we take a look at two of the best BI tools on the market: Microsoft Power BI and Tableau.
Business intelligence software
BI software facilitates the streamlined analysis of data.
It essentially allows a company to gather real-time business data and turn it into valuable insights to gain a competitive edge and react to problems and changes in the market. This is done with the help of reports and visualizations.
Overall, enterprises are able to quickly make informed decisions with BI software, due to its ability to process and analyze large business data sets.
Features
|
Microsoft Power BI |
Tableau |
|
Capable of handling large data sets but Tableau performs better |
Capable of handling large data sets |
|
Capable of using numerous data points for visualization |
24 types of visualizations available to users |
|
Can be used by both novice and experienced users |
Geared toward more experienced users |
|
Embedding reports is straightforward |
Embedding reports can be challenging |
The key takeaway from comparing the features of these two applications is that there is a steeper learning curve for Tableau, which can limit the user base to more technical personnel like analysts.
If an enterprise requires a large number of people to have access to its BI software, then Tableau is a choice that won’t work well for you. In this case, Power BI is the better option.
It is also worth noting that while both Tableau and Microsoft Power BI offer both stand-alone and cloud solutions, Tableau has proven to be easier to implement overall.

A screenshot of Microsoft Power BI's sales and marketing dashboard visualizations. Photo via Microsoft.
Integrations
|
Microsoft Power BI |
Tableau |
|
Integrates well with several Microsoft products |
Integrates well with some Microsoft products like Excel and SQL Server |
|
Integrates with Google Analytics |
Integrates with Google Analytics |
|
Integrates with Salesforce |
Integrates with Salesforce |
|
Integrates well with data science tools but no direct MATLAB integration |
Integrates well with data science tools, such as Python and MATLAB |
If an enterprise uses Microsoft products, then Power BI may be the best choice. On the other hand, if a team heavily relies on MATLAB for data science, then Tableau is the better option.
Benefits
|
Microsoft Power BI |
Tableau |
|
Easy-to-clean data |
Elaborate visualizations possible |
|
Mobile device support |
Mobile device support |
|
Responsive visualizations |
Responsive visualizations |
|
Easy to learn |
Great customer support |
It’s generally easier to clean data in Microsoft Power BI than it is in Tableau. With Tableau, it’s usually easier to get started on a data set that doesn’t require as much cleaning.
With that being said, Microsoft Power BI is a bit easier for users to learn.

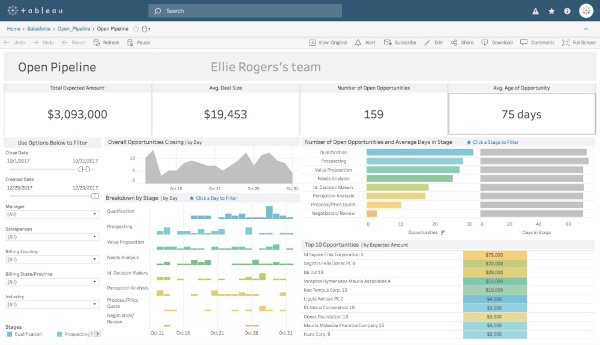
A screenshot of a Salesforce pipeline template in Tableau. Photo via Tableau.
|
Site |
Microsoft Power BI |
Tableau |
|
Capterra |
4.5/5 |
4.5/5 |
|
G2 |
4.3/5 |
4.5/5 |
|
TechnologyAdvice |
4.5/5 |
4.5/5 |
|
TrustRadius |
8.3/10 |
8.3/10 |
Tableau users tend to discuss how they value the platform for its powerful features. However, several reviewers note that there is a bit of a learning curve with the application.
Reviews of Microsoft Power BI tend to cite its ease of use, functionality, value and level of support.
Pricing
|
Microsoft Power BI |
Tableau |
|
|
Microsoft Power BI pricing is generally cheaper than Tableau, especially if a customer has the Microsoft Power BI Pro plan. Tableau’s pricing can be more complicated, but it has a fairly good explanation of pricing on its website.
Overall
|
Category |
Microsoft Power BI |
Tableau |
|
Ease of use |
X |
|
|
Implementation |
X |
|
|
Customization |
X |
|
|
Integrations |
X |
|
|
Customer support |
X |
|
|
Functionality |
X |
Overall, Microsoft Power BI is more accessible for more users in an organization. Tableau allows for powerful visualizations, but it requires deeper knowledge of business intelligence and data science to use it effectively.