Aha Statistics – By Region, Revenue, Traffic and Market Share

Page Contents [hide]
Introduction
Aha Statistics: Aha OTT platform is one of the most famous platforms in the Telegu and Tamil-speaking population. OTT platforms are providing the greatest entertainment time for all people around the world. Since the pandemic, OTT’s were the only source to watch freshly uploaded content as television was broadcasting the same episodes due to lockdown. The choice of n number of OTTs in the market for entertaining people is creating a cutthroat competition provided by much free online content. In this Aha Statistics, we will have some insight into the platform’s general statistics, and other statistics by region and by traffic, and demographic.
Aha Statistics (Editor’s Choice)
- Content can be watched only in Tamil and Telugu languages.
- As of November 2021, the total paid subscribers were 15 million.
- The platform has 34.07% female users and 65.93% male users.
- India recorded around 82.53% of the total traffic with a percentage of 3.24% increase rate in traffic towards the website in the last month.
- Aha can be watched on multiple devices such as Samsung TV, LG TV, Mi Patchwall, Apple TV, iOS and mobile devices, desktop, and tablets.
What is Aha?
Aha is an Indian OTT and video-on-demand platform that offers movies and other content in Tamil and Telugu languages only. The platform is owned by Arha Media and Broadcasting Private Limited.
Features of Aha
- Movies and other content can be downloaded to watch without an internet connection.
- The platform has various categories in movies such as romance, action, comedy, and drama.
- The platform has parental control over the content.
- Aha can be accessed over the world.
- Aha also supports children with suitable content.
- Aha can be watched on multiple devices such as Samsung TV, LG TV, Mi Patchwall, Apple TV, iOS and mobile devices, desktop, and tablets.
- Downloaded content is available to watch for 30 days only.
- Content can be watched in 4K ultra-HD and Dolby.
- Content can be watched only in Tamil and Telugu languages.
General Aha Statistics
- According to Aha statistics, the supports content only in Tamil and Telugu languages, but users can view the website in the English language.
- As of November 2021, the total paid subscribers were 15 million.
- In the month of November 2022, aha. video had around 4.8 million total visits. A similar number of visitors to the website was observed as 4.8 million.
- In the month of September 2022, there were a total of 3.3 million visits.
- Aha statistics show that the platform has 34.07% female users and 65.93% male users.
- According to Aha statistics, the website aha. the video has 66.38% organic traffic and 33.62% paid traffic.
By Region

(Reference: Similerweb)
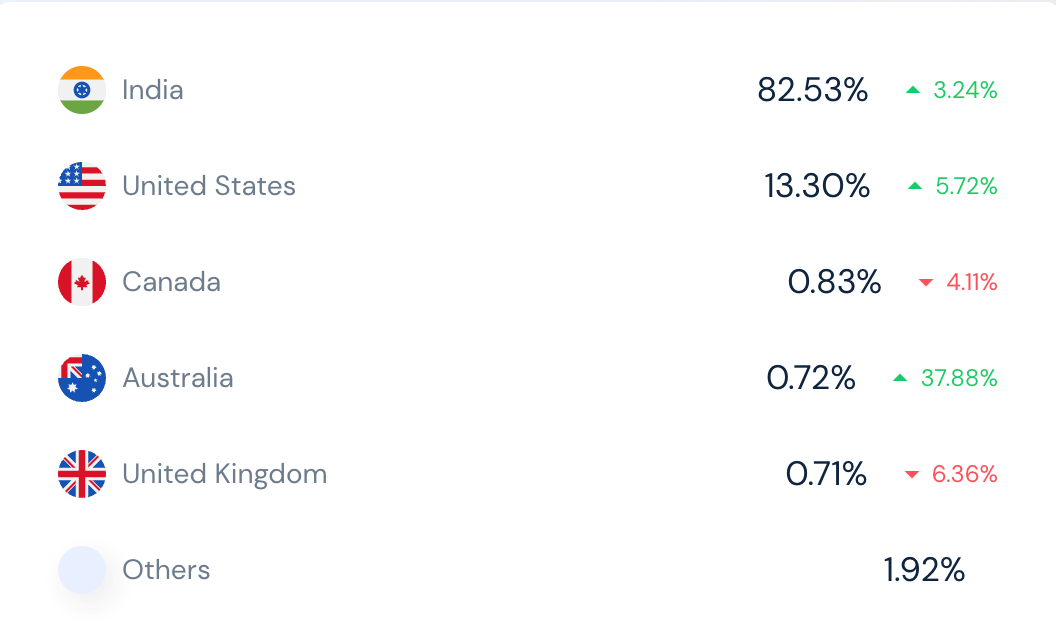
- According to Aha statistics, India recorded around 82.53% of the total traffic with a percentage of 3.24% increase rate in traffic towards the website in the last month.
- United States of America ranks in second place with total traffic in the last month resulting in 13.30%, this has shown a 5.72% of increase rate in visitors.
- Canada has a traffic contribution of around 0.83%, this has recorded a 4.11% decrease in the rate of visitors.
- In the last month, Australia and the United Kingdom recorded total traffic of 0.72% and 0.71% respectively.
- Australia recorded an increased rate in traffic by 37.88% whereas, the United Kingdom recorded a decrease rate of 6.36%.
- Whereas other countries with negligible traffic rates are around 1.92%.
By Traffic
- Aha.video states that the traffic towards the website resulted in 70% from direct traffic being the highest.
- Overall referral traffic is around 0.43%.
- Search traffic is around 28.49% from around the world.
- Social media traffic, mail traffic, and display traffic are around 0.41%, .040%, and 0.26% respectively.
- In terms of social media networks, YouTube sends around 72.52% of the traffic to the website, whereas LinkedIn sends around 15.28%.
- WhatsApp sends referral traffic by 6.75%, whereas the percentage of traffic is 2.52%, 2.04%, and 0.90% belong to Reddit, Facebook, and other social media with negligible percentages respectively.
Aha statistics by demographic

(Reference: Similerweb)
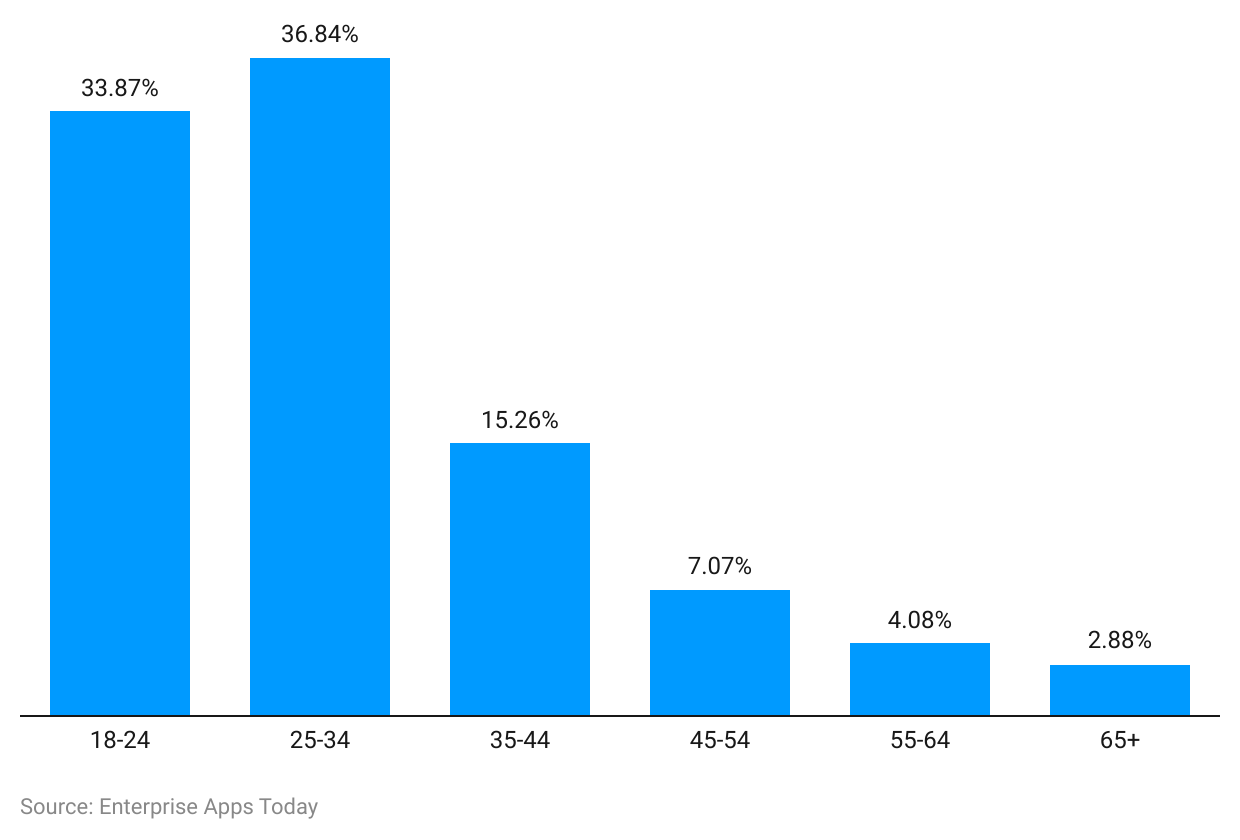
- Aha Statistics show that the platform has users from the age group of 18 years to 24 years by 33.87%.
- There are 36.84% of the users from around the world from the age group of 25 years to 34 years.
- Users from the age group of 35 years to 44 years are around 15.26% in total. Whereas people from the age group of 45 years to 54 years result in 7.07% as stated by Aha statistics.
- Users from the baby bloomers are contributing total demographic traffic by 4.08% and 2.88% from the age group of 55 years to 64 years and 65 years and more respectively.
Conclusion
Even though the Aha OTT platform is not really famous in Hindi or any Indian language-speaking regions other than Telugu and Tamil, it is yet a good OTT platform. Unfortunately, the platform supports only two languages but considering that population, the content is extremely good along with children's suitable episodes and movies. Such OTT platforms are gaining more popularity day by day as they can be accessed from international boundaries also. OTT platforms have a better future in India than in other countries around the world as told by many studies over the internet. If you are a Tamil and Telugu languages speaker then this is one of the best platforms for you!
Sources
FAQ.
Aha gold pan is available for 699 a year, Telugu annual plan is available at 399 a year and Telugu quarterly plan is available at 199 for 3 months.
Indian users can pay via Debit and with credit cards, Netbanking, Google Pay, BHIM, Apple Pay, and various wallets and UPI methods. While international users can use scan the Indian QR code and payment subscription fees.
Aha is available in Telugu and Tamil but website can be viewed in English.
Aha can be watched on multiple devices.

Barry is a lover of everything technology. Figuring out how the software works and creating content to shed more light on the value it offers users is his favorite pastime. When not evaluating apps or programs, he's busy trying out new healthy recipes, doing yoga, meditating, or taking nature walks with his little one.


