Coffee Industry Statistics – By Country, Region, Demographic, Coffee Variant and Brand

Page Contents
- Introduction
- Editor’s Choice
- What is Coffee?
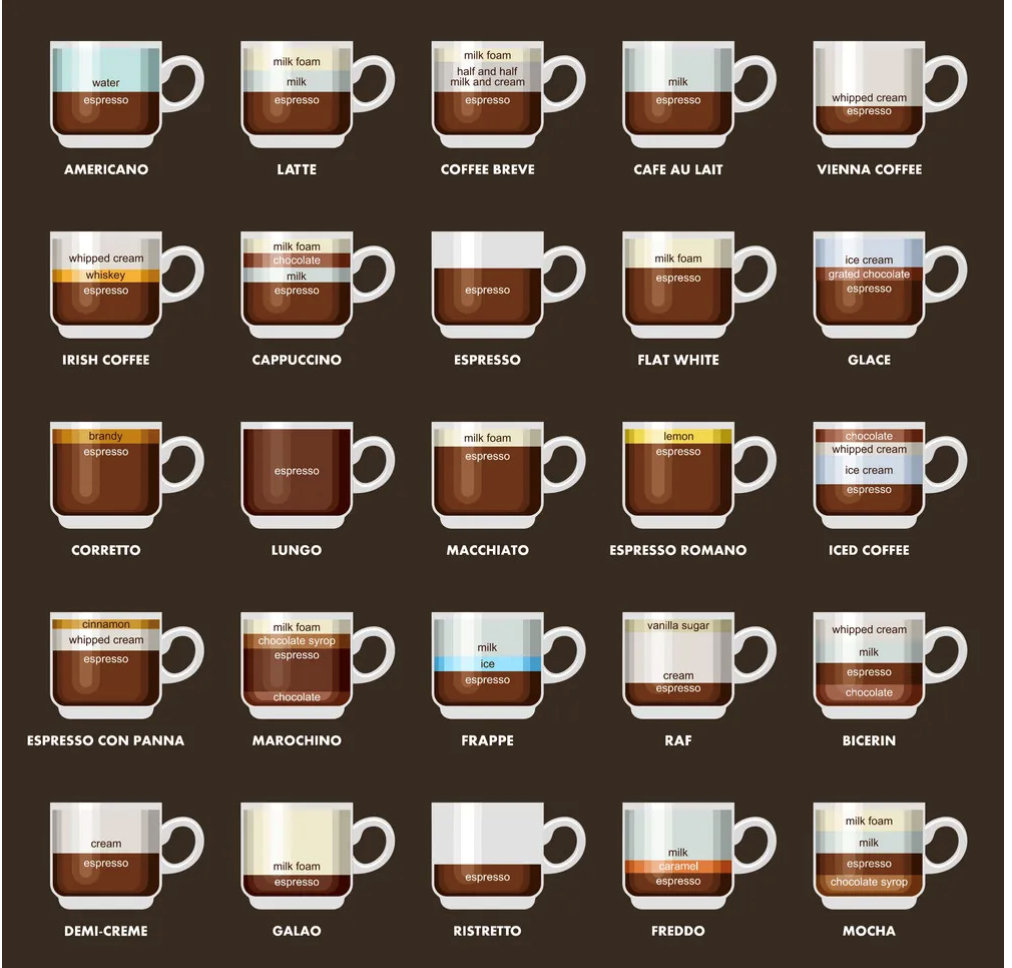
- Types of Coffee
- Benefits of Drinking Coffee
- General Coffee Industry Statistics
- Coffee Industry Statistics By Type
- Coffee Industry Statistics By Purchase Frequency
- Coffee Industry Statistics (10-year analysis)
- Coffee Industry Statistics By Country
- Coffee Industry Statistics By Region
- Coffee Industry Statistics By Spending Habit
- Coffee Industry Statistics By Demographic
- Coffee Industry statistics By Additional Ingredients
- Coffee Industry Statistics By Brand
- Statistics By Coffee Variant
- Statistics By Coffee Shop Start-up Expenses
- Conclusion
Introduction
Coffee Industry Statistics: Let’s meet over a cup of coffee! Isn’t that a famous line in corporate as well as friends circle? Well, coffee is the most demanded beverage during office meetings and first dates between couples. Book lovers mostly drink coffee while reading a book. Coffee is one of the top three most demanded beverages around the world. It is of course an easy-to-make drink and provides short-term energy.
These mouth-watering Coffee Industry Statistics are going to make you brew one cup of coffee for yourself while reading this.
Editor’s Choice
- As of 2022, Starbucks has a 92% of brand awareness among restaurant in-chain customers in the United States of America.
- According to Coffee Industry Statistics, as of 2022, in the United States of America, there were around 38,411 coffee shops available.
- 32% of Coffee consumers in the USA usually buy coffee from coffee shops 1 to 3 times a week.
- The American coffee market is projected to grow at CAGR of 5.14% between 2023 to 2025.
- More than half of the coffee lovers in the United States of America love to eat coffee cake resulting in 55%.
- As of 2022, 39% of consumers in the United States of America prefer Starbucks coffee.
- On average, a person in the United States of America drinks 3 cups of coffee a day.
- By 2025, the revenue of the roasted coffee market in the United States of America is projected at $66.6 billion as stated by Coffee Industry Statistics.
- 10% of the coffee lovers enjoy coffee soda, while 8% and 4% voted for Affogato and other coffee-themed dishes.
- 31% of coffee lovers brew coffee by dripping methods along with Keurig.
What is Coffee?
Coffee is another popular type of beverage around the world. According to Coffee Industry Statistics, around 25 million small-scale producers depend on coffee to make up for their living globally. Coffee is a beverage made from roasted coffee beans. Because of its caffeine feature, it commonly impacts the human body and provides energy for a specific period of time.
Types of Coffee
Benefits of Drinking Coffee
- Drinking coffee on a regular level can reduce the risk of stroke, kidney disease, and diabetes.
- Coffee consumers are less likely to develop heart failure.
- Moreover, there are fewer chances of developing Parkinson’s disease.
- Increase energy in the body as well as improves the attention level of the mind.
- It is a better source of healthy antioxidants.
- Keeps you away from the risk of developing heart problems.
General Coffee Industry Statistics
- According to Coffee Industry Statistics, as of 2022, in the United States of America, there were around 38,411 coffee shops available.
- In the United States of America, the total number of employees in the coffee and snack shop sector as of 2022 was 230.83K.
- As of 2022, Starbucks has a 92% of brand awareness among restaurant in-chain customers in the United States of America.
- According to the American Customer Satisfaction Index score, in the United States of America, Starbucks scored 77.
- 52% of consumers are voting to buy ethical coffee.
- 70% of coffee drinkers prefer to make coffee at home.
- 68% of people love to drink coffee while working.
- 70% of the consumers in the United States of America drink coffee weekly, while 62% of them drink it every day.
- On average, a person in the United States of America drinks 3 cups of coffee a day.
- On the other hand, 40% of the consumers drink 2 cups of coffee while 9% drink 6 to 8 cups a day.
- 87% of Americans call themselves somewhat or fully coffee addicted.
- Around the world, 2.25 million cups of coffee are served every day.
- 50% of independent coffee businesses fail to operate within 5 years of their launch.
- According to Coffee Industry Statistics, Coffee ranks second as the most traded commodity around the world.
- Furthermore, in Canada, for every 9,000 people there is at least one Tim Hortons Shop.
- According to Coffee Industry Statistics, the segment is worth $80 billion.
- 67% of Americans buy coffee beans at the grocery store.
- According to Coffee Industry Statistics, Coffee Shops are the trending niche for growing restaurant businesses.
- 17% of Americans love to drink coffee from 12 pm to 4 pm, while 16% of the people drink it between 4 pm to 7 pm.
- Furthermore, 12% of coffee lovers drink coffee before noon and 12% of Americans drink coffee from 7 pm to 10 pm.
- In the United States of America, while drinking coffee, there are 35% of people take only 1 packet of coffee while 16% of the consumers prefer to pour 3 packets to make coffee.
- Furthermore, 7% and 3% of Americans use respectively 4 and 5 packets.
- And there are 2% of the people use 6 coffee packets and 1% use 7 to 10 coffee packets while making the coffee.
Coffee Industry Statistics By Type
- By 2025, the revenue of the roasted coffee market in the United States of America is projected at $66.6 billion as stated by Coffee Industry Statistics.
- 49% of the consumers in America prefer medium roast coffee while 28% like dark roast.
- 12% of coffee lovers prefer light roast while 11% have no roast preferences.
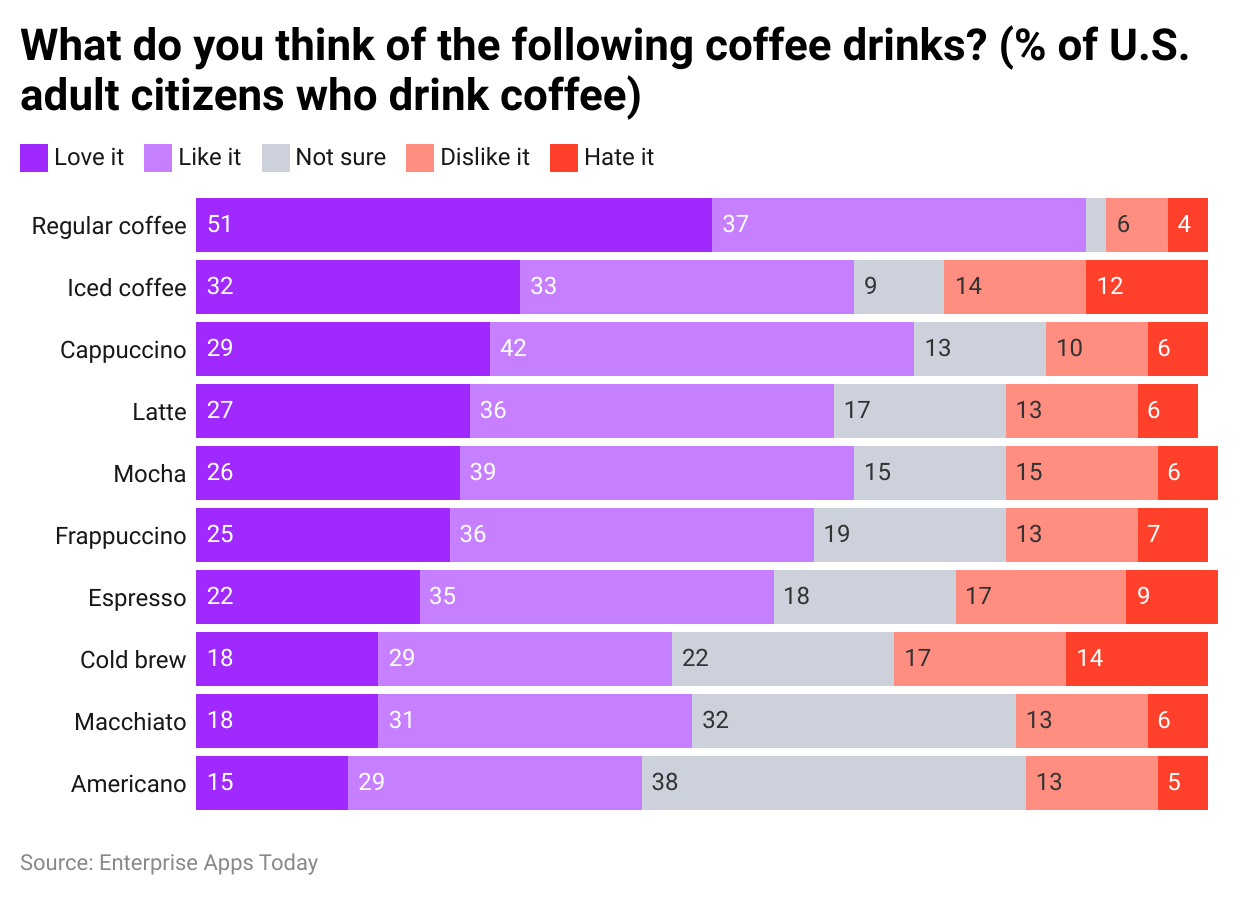
- Moreover, 41% of consumers prefer black coffee.
- Cold coffee has a $29 million market in the United States of America.
(Reference: today.yougov.com)
Coffee Industry Statistics By Purchase Frequency
- 32% of Coffee consumers in the USA usually buy coffee from coffee shops 1 to 3 times a week.
- 6% of coffee lovers buy coffee outside the home every day.
- Couples who are Stay at home parents purchase coffee from coffee shops 1 to 3 times a week while 50% of couples who have just become parents purchase at a similar frequency.
- 30% of coffee consumers buy less than a week while 10% purchase coffee 4 to 6 times a week.
- And 22% of the consumers have never purchased coffee at coffee shops.
Coffee Industry Statistics (10-year analysis)
By Revenue
(Reference: Statista.com)
By Average Revenue Per Capita (10-year analysis)

(Reference: Statista.com)
By Online Revenue Share (10-year analysis)
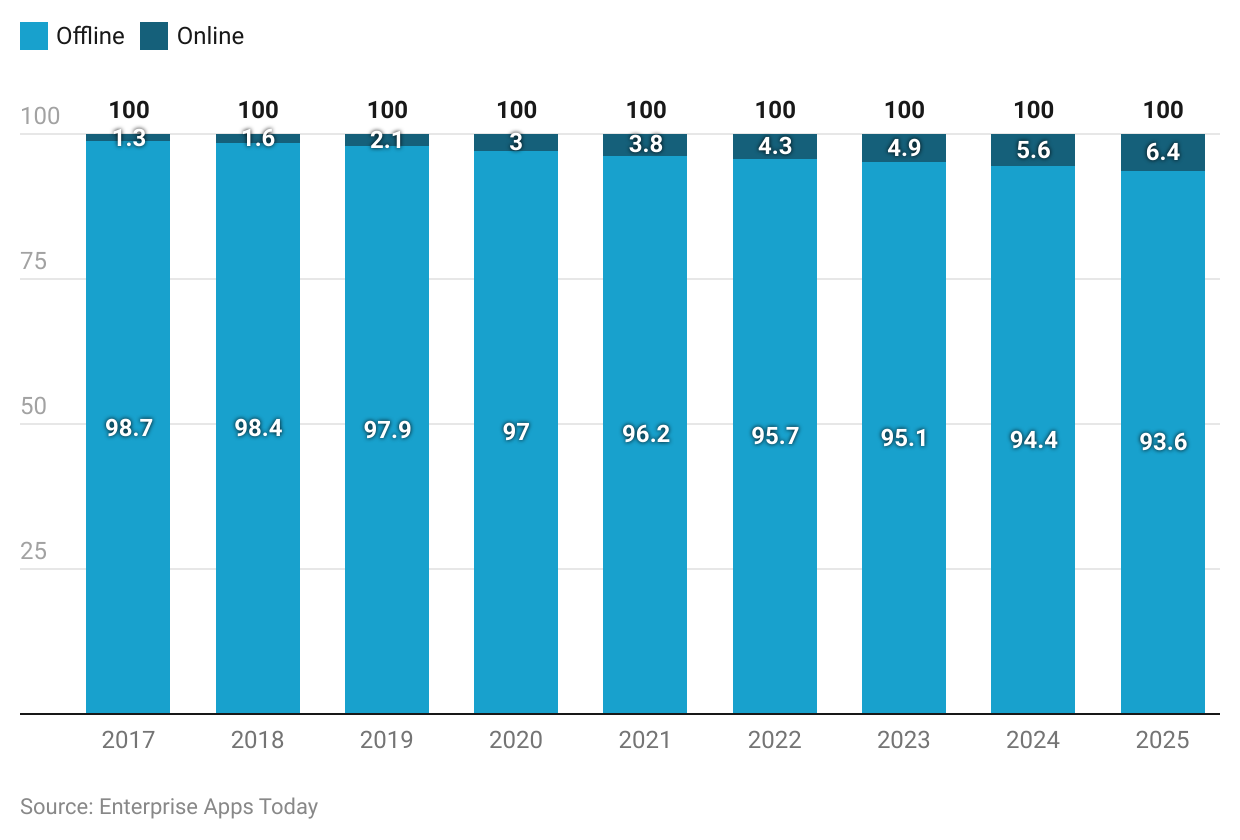
(Reference: Statista.com)
By Out-of-home Revenue Share (10-year analysis)
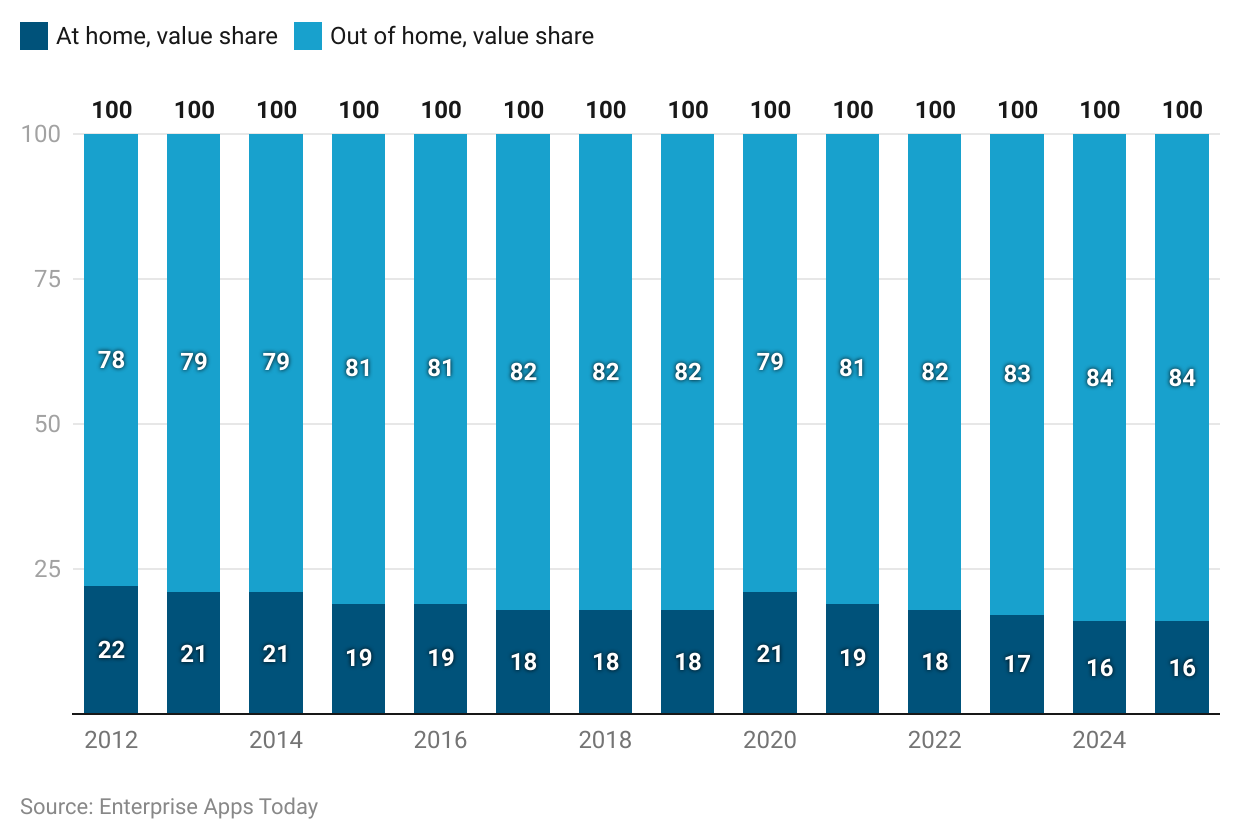
(Reference: Statista.com)
Coffee Industry Statistics By Country
- Brazil tops the list for the world’s largest coffee producer resulting in 40% of total production.
- Other than Brazil, Indonesia, Vietnam, and Colombia are the largest coffee producers.
- The top 10 coffee-consuming countries belong to Europe.
- Coffee drinkers in the United Kingdom pay more for coffee than in any other country resulting in $16.
By Revenue of the Coffee Market
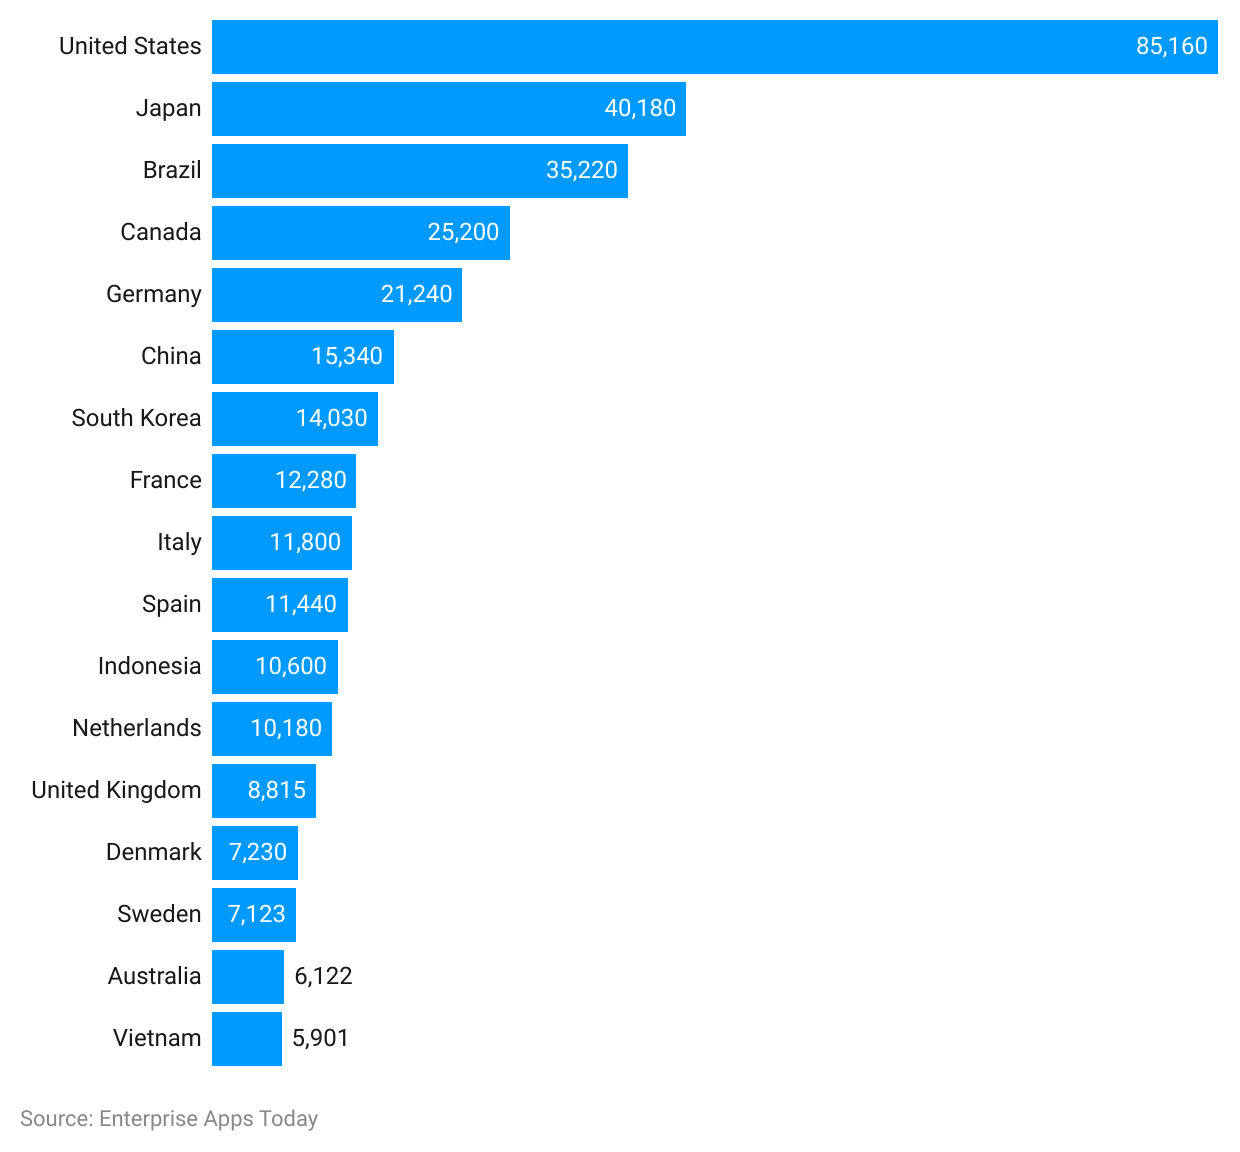
(Reference: Statista.com)
- The top three markets for coffee as of 2022 are the United States of America, Japan, and Brazil with respective revenues of $85,160 million, $40,180 million, and 35,220.
- Switzerland, Thailand, and Mexico have the lowest contribution toward revenue compared to other countries resulting in $3,288 million, $,3,185 million, and $2,752 million.
By Exports Jan 2022
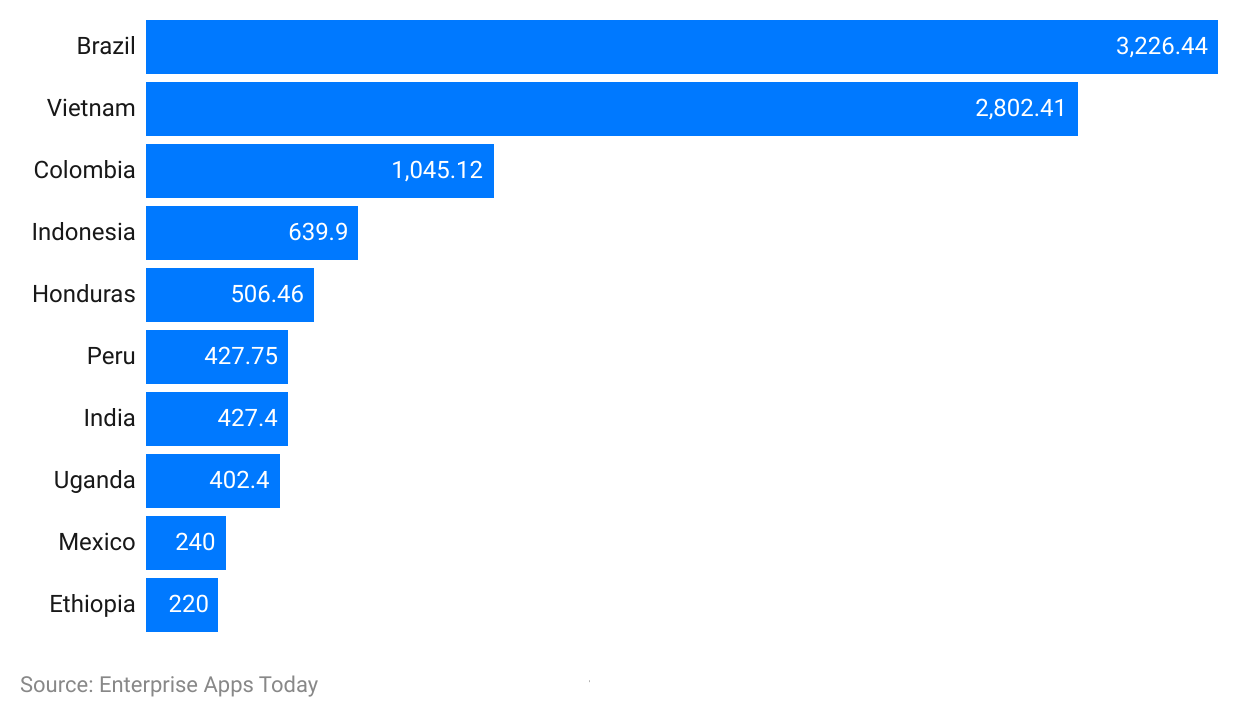
(Reference: Statista.com)
- According to Coffee Industry Statistics of 2022, Brazil ranked top in the list of Coffee export volumes worldwide in 2022 as it exported around 3,226.44 thousand kilo sacks.
- Vietnam and Colombia ranked respectively for exporting 2,802.41 and 1,045.12 thousand kilo sacks in 2022.
- Further countries in the list of top leading countries by Coffee exports are Indonesia (639.9), Honduras (506.46), Peru (427.75), India (427.4), Uganda (402.21), Mexico (240), and Ethiopia (220).
Coffee Industry Statistics By Region
(Reference: marketresearchfuture.com)
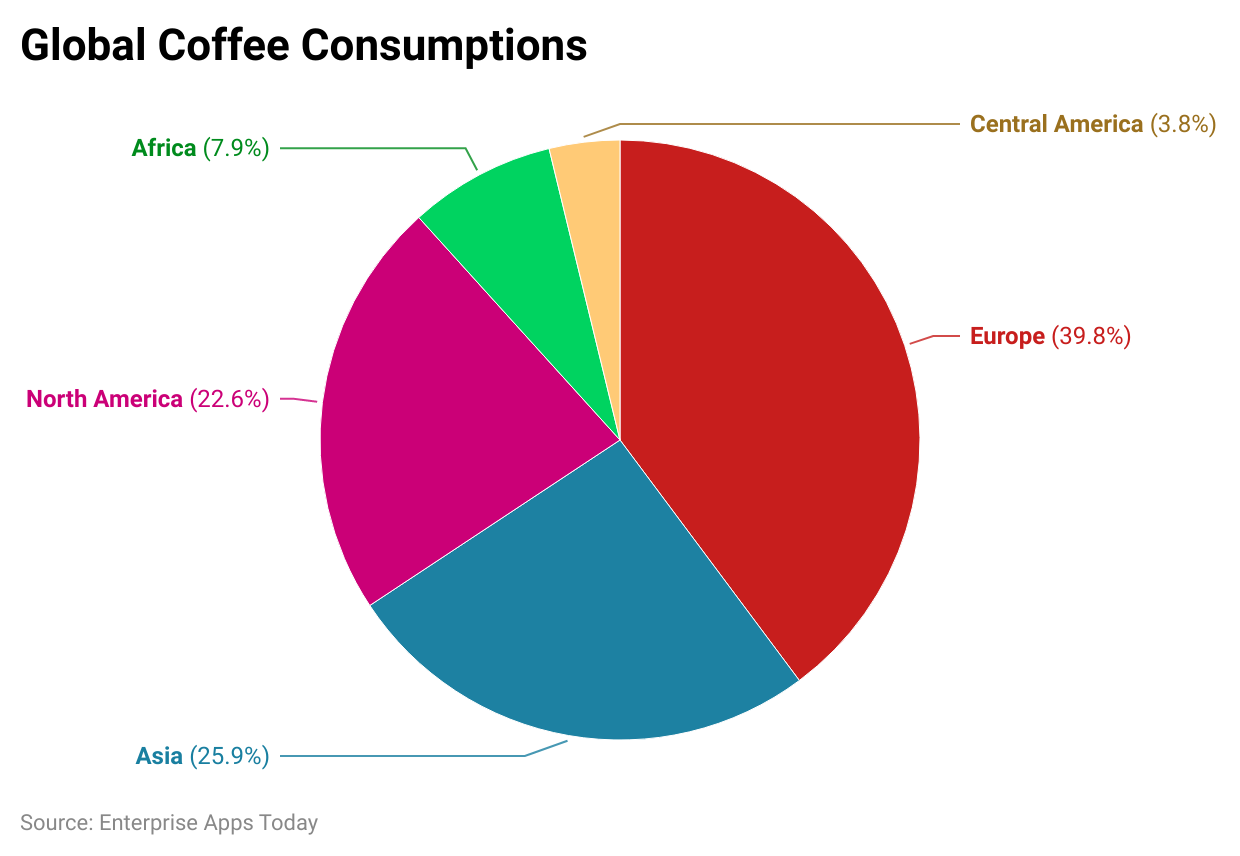
- The region-wise global coffee consumption as of 2022 is highest in Europe resulting in 39.8%.
- Whereas Asia and North America ranked respectively with 25.9% and 22.6% of coffee consumption share.
- Africa has coffee consumption of around 7.9% as of 2022.
- And central America has only 3.8% of coffee consumption.
Worldwide
- By the year 2025, the volume of the global Coffee Segment is expected to reach 7.78 billion kg.
- Moreover, Coffee Industry Statistics state that the segment is projected to grow at a rate of CAGR 1.9% by the year 2024.
- The global average volume per person is projected at 0.98kg in 2023.
- The global comparison of the Coffee segment state that the highest revenue is generated in the United States of America, projected to reach $95,580 million in 2023.
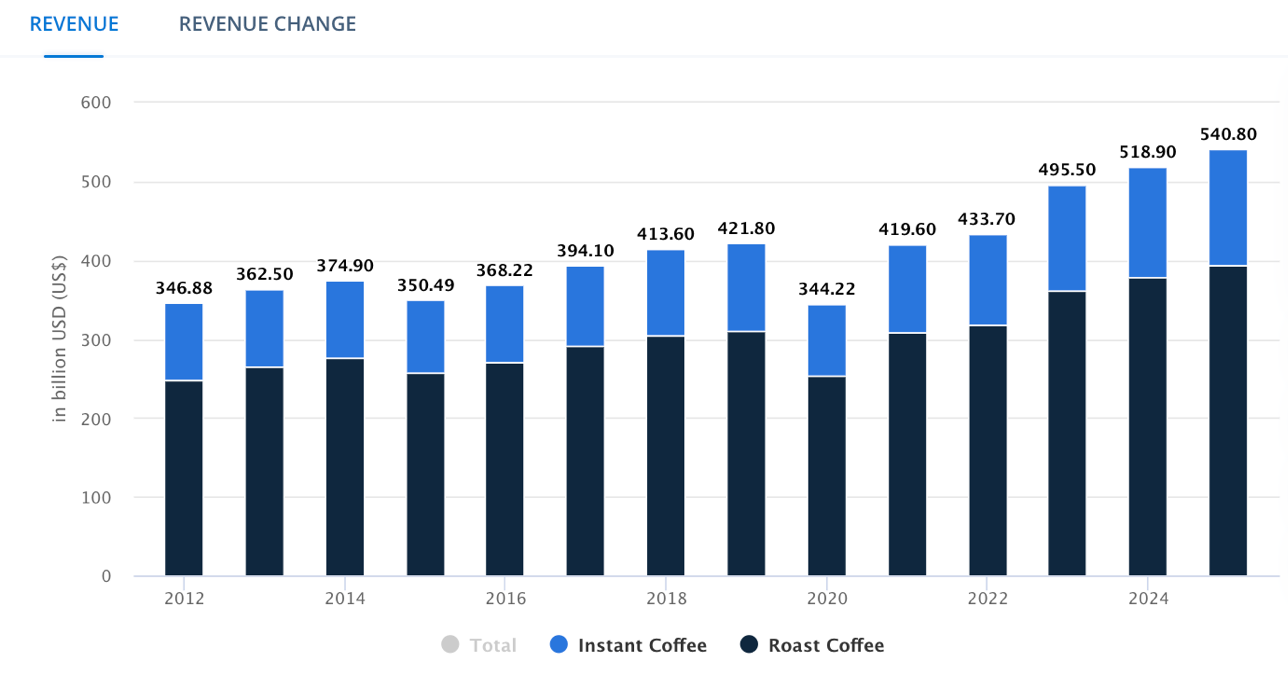
- Moreover, the revenue in the global coffee market as of 2023 amounts to $495.50 billion.
- As of 2025, out-of-home consumption i.e., in bars and restaurants will be contributed 84% of the spending and 21% of volume consumption in the global Coffee Market.
- As of 2023, revenue change in the global Coffee segment is 14.3%.
Americas
- The American coffee market is projected to grow at CAGR of 5.14% between 2023 to 2025.
- Moreover, per-person revenues generated amount to $184.60, and the average volume per person is projected at 3.18kg as of 2023.
- By 2025, it is projected that the volume is expected to amount to 3.36 billion kg showing an expected growth of 2.3% in the year 2024.
- The coffee segment further states that out-of-home consumption will be contributing 22% of volume consumption and 86% of spending by the year 2025.
Asia
- Asian Coffee Market states the expected average volume per person is 0.33kg as of 2023.
- Out-of-home consumption will be contributed 22% of volume consumption and 85% of spending in the Asian coffee segment by the year 2025.
- As of 2023, per-person revenues are $31.39 compared to the total population.
- Moreover, the coffee segment is expected to grow at a volume growth of 2.6% by the year 2024, with an expected volume reaching 1.58 billion kg as of 2025.
- As of 2023, the change in the Asian coffee market revenue is 14.5%
Africa
- As of 2023, the African coffee segment revenue has a 12% change in revenue.
- Moreover, per-person revenues are $8.77 as of 2023.
- 11% of volume consumption and 66% of spending will be contributed by out-of-home consumption by the year 2025.
- By the year 2025, the volume is expected at 541 m kg with a growth of 3.1% in 2024.
- As of 2023, the revenue in the African coffee segment amount to $11.02 billion, and it is expected to grow at CAGR of 2.82% between 2023 to 2025.
Europe
- In the European coffee market, 22% of volume consumption and 81% of spending will be contributed by out-of-home consumption.
- As of 2023, per-person revenues are $173.90 as compared to the total population.
- Moreover, as of 2023, the average volume per person is 2.60kg.
Coffee Industry Statistics By Spending Habit
- 31% of Coffee consumers who make coffee at home spend around $11 to $20.
- There are around 11% of consumers spend around $40 on making coffee at home.
- While there are 25% and 15% of the people spend around $21 to $30 and $31 to $40 respectively.
- And there are 13% of coffee lovers spend less than $10 on making coffee at home.
- While 5% have no idea about spending.
Coffee Industry Statistics By Demographic
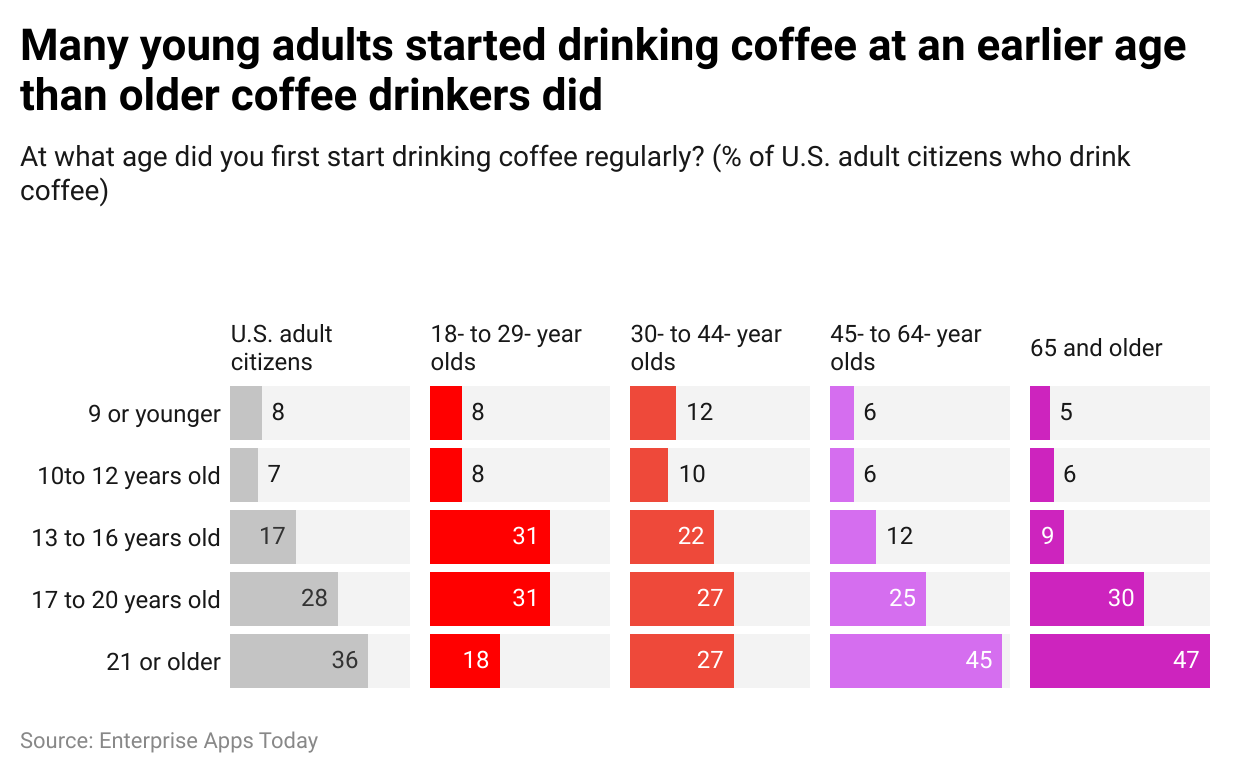
- Millennials and Gen X people have a high rate of coffee consumption compared to other generations.
- Moreover, the rate of coffee consumption is higher in men resulting in 50.8% than in women resulting in 32.8%.
(Reference: today.yougov.com)
Coffee Industry statistics By Additional Ingredients
- While 41% of Americans love black coffee, there are other ingredients with which Americans love to drink coffee.
- There are 5% of the people make coffee with soy milk, while 7% use 1% contained milk.
- 9% respectively use skim milk and coconut milk.
- There are 10% and 11% of people love to make coffee using oat milk and creamer.
- 14% of the people use almond milk, while 16% love light cream, and 18% use 2% contained milk.
- On the other hand, 48% of coffee consumers use generic creamers and 39% of coffee lovers drink coffee by 50% method of black coffee and with generic creamers.
Coffee Industry Statistics By Brand
- As of 2022, 39% of consumers in the United States of America prefer Starbucks coffee.
- While 35% and 30% drink at Folgers Coffee and Dunkin respectively.
- Moreover, 21% of coffee lovers drink coffee at green Mountain while 17% go to McCafé.
- 15% of people prefer to drink coffee at Peet’s while 13% choose Eight O’clock.
- Furthermore, as of 2022, 11% of coffee consumers in the United States of America chose Café Bustelo, 7% went to Tim Hortons and 5% chose La Colombe.
Statistics By Coffee Variant
- More than half of the coffee lovers in the United States of America love to eat coffee cake resulting in 55%.
- Moreover, 48% of consumers enjoy coffee ice cream while 30% love Irish coffee.
- 24% of the people prefer coffee liquor while 14% enjoy espresso martinis.
- 10% of the coffee lovers enjoy coffee soda, while 8% and 4% voted for Affogato and other coffee-themed dishes.
- Moreover, 28% of the people like coffee somewhat sweetened, while 22% want it a little sweetened.
- On average, 38% of Americans drink coffee without any sweeteners.
- And only 4% of coffee drinkers never used any sweeteners at all. Statistics brewing method
- 31% of coffee lovers brew coffee by dripping methods along with Keurig.
- 23% of the people brew coffee by ground method while 6% do it instantly.
- 4% of the consumers love French press along with trying various ways.
- And 1% of coffee lovers brew it by the whipped method.
Statistics By Coffee Shop Start-up Expenses
- As of 2023, according to Coffee Industry Statistics, the average cost to open a Coffee Shop is between $80,000 to $3,00,000 depending on the business size.
- Startups with the highest quality coffee-making equipment can cost more than $10,000.
- 60% to 65% of the initial start-up costs are contributed to labor.
- The average margin behind regular coffee and specialty coffee is between 15% to 20% and 12% to 18% respectively.
- Mobile coffee shops can cost around $60,000.
Conclusion
Having a cup of coffee in the morning has become a routine for most Americans. Moreover, there are millions of people around the globe who are addicted to this beverage. But drinking excessive coffee is harmful to health and can badly affect the brain as well as the heart. Therefore, limit the consummation of caffeine in your daily routine and live a healthy life!
Sources
FAQ.
The Kraft Heinz Company, Nestle SA, The Coca-Cola Company, Tata Global Beverages, Starbucks Coffee Company, Tchibo GmbH, Strauss Group Ltd, and JAB Holding Company are some of the key players in the global coffee market.
The projected global coffee market growth rate is 4.6% CAGR between 2023 to 2033 and is expected to reach $53.5 billion by 2033.
As of 2022, the European region has the largest market for the coffee industry as it contributes around 35% of the world's market share in the coffee industry. In the European region, the consumption is 54,065 thousand coffee bags per 60 kg.
Hot brewed and black coffee is the healthiest to drink as it has no fat, no calories, and is low in sodium. Black coffee is full of niacin, magnesium, potassium, and micronutrients.

By conducting scientific research, I write about illness, health and healthcare. As a professional medical writer, my experience includes creating feature articles for newsletters and websites as well as research news stories for doctors and researchers. Reading has been an integral part of me since childhood - I'm fan of "Friends" and the "Harry Potter series". Before this career, I was employed by a French multinational company. However, my passion for reading led me to pursue writing professionally; my first Amazon-published short story entitled "The envelope that changed our lives" has recently been released. In my free moments, I enjoy long bike rides around town.
