Paid Family Leave Statistics – By Demographics, Company Size, Employees, Industries, Length Of Leave, Type, Age and Gender, Single and Married Women
Page Contents
Introduction
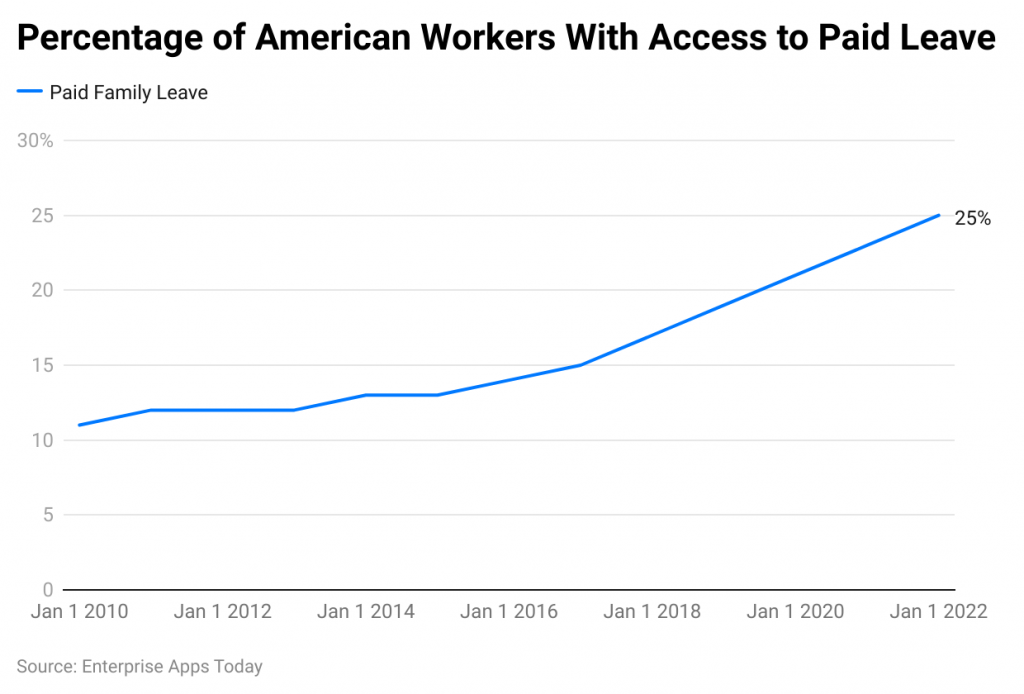
Paid Family Leave Statistics: Paid Family Leave (PFL) is a benefit that employees get leave for specific reasons such as childbirth, child adoption, child sickness, and serious medical condition for parents and spouses but not for their own health conditions. Firstly employees of any company before taking leave must contact their employers and make them understand their circumstances before granting permission. PFL requires eligibility criteria such as employees must have a record of working 175-182 days and 20 hours or more / week. This leave is also known as ‘family caregiver leave’ or ‘family leave insurance.’ In the United States in 2022, private sector workers have used 23% of PFL.
These Paid Family Leave Statistics include important information from different aspects that will provide light on why paid family leave is essential for employees.
Editor’s Choice
- As of 2022 in the United States, the workers in the private sector have accessed by 23% to Paid Family Leave.
- Short-term disability insurance was accessed by 42% of private sector employees.
- Paid family leave was accessed within 12 states of the United States by the end of 2022.
- In 2022, the paid family was supported by 825 Americans.
- The PFL has improved 90% of the overall business and 99% improved employee morale.
- The participation of the labor force was increased by 20% under the paid leave law of California.
- In the United States, for newborn child care 1 out of 5 employees took PFL.
- In PFL, Oregon is the most generous state and New York is the least generous in 2022.
- Tech sectors have offered PFL to 30% of employees for parental leave.
- Paid family leave benefits were being provided by 60% of U.S. small businesses.
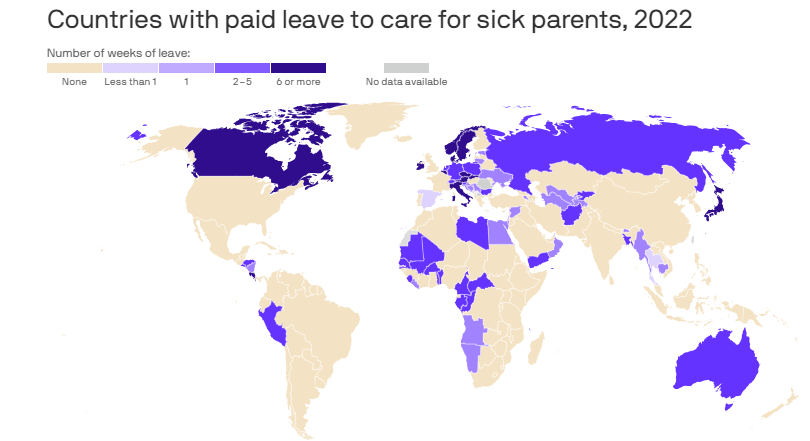
- Across the world, 120 countries were having paid family leave by the end of 2022.
Facts About Paid Family Leave
- U.S. states don’t have PFL in such cases around 30% of women quit jobs after having a newborn.
- Availability of PFL in states of U.S. 20% less women has quit their jobs.
- 42 years old individuals have taken some sort of paid family leave.
- The PFL has benefited 50% of caregivers, cancer patients, and survivors by allowing completing patient treatment.
- As per a survey of 2022, almost 50% of American employees agreed to pay taxes more than $200 for PFL.
- 70% of employees were ready to pay 1% of each dollar they earn for getting PFL whenever they need.
- PFL for child adoption stats by demographics in the U.S.: white employees = 57%, black employees = 54%, and Hispanic = 41%.
- In 2022, the paid parental leave stats by time: 45% of women = 12 weeks, 16% of women = 2 weeks, and 10% of women = above 12 weeks.
General Statistics
- As of 2022, paid parental leave was accessed by 63% of countries globally.
- The paternity leave in 2022 has decreased by 27% and the maternity leave has decreased by 53%.
- 28% of employers offered PFL to Parents who have adopted a child in 2022 and adopting leave has also reduced to 22% in the last 2 years.
- In PFL, Oregon is the most generous state and New York is the least generous in 2022.
- PFL for birth or adoption was accessed by 45% of women aged between 18 – 34 years in 2022.
- According to research in 2022, 69% of employees working across the world take care of their parents, and out of 10 only 4 got paid family leave.
- In 2022, employees received parental leaves from 33% of employers, 28% of employers offered adoption leave and 22% of employers offered foster care leave, and 31% of employers offered paid leave for family care.
(Reference: statista.com)
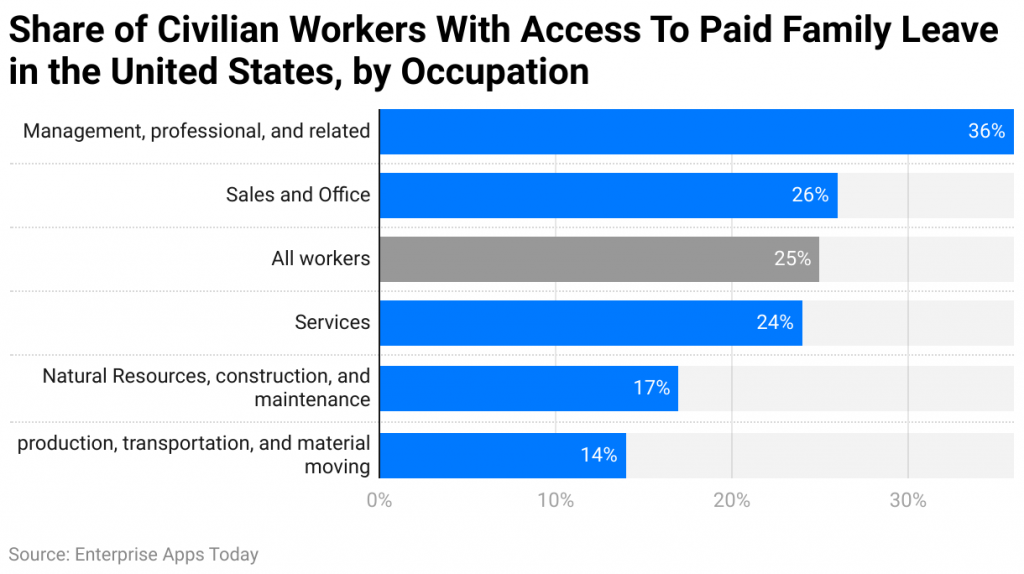
- The above graph represents the U.S. workers paid family leave statistics by occupation.
- As of March 2022, management, professional, and related other occupations accessed the most PFL by 36% and the least accessed occupation was production, transportation, and material moving by 14%.

(Reference: zippia.com)
- Men: Fully pay = 55%, Partial pay = 20%, and No pay = 25%
- Female: Fully pay = 32%, Partial pay = 28%, and No pay = 41%
(Source: app.leg.wa.gov)
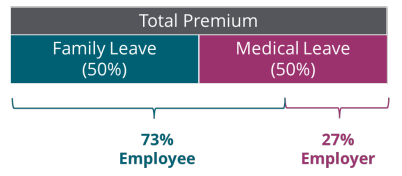
- The above image describes the stats of the family and medical leave split in January.
- As of January 2022, contribution of employees = 73.22% and employers = 26.78%
- Family leave = 51.31%
- Medical leave = 48.69%
As of 2023, contribution of employees = 49.52% and employers = 27.24%
(Source: business.org)
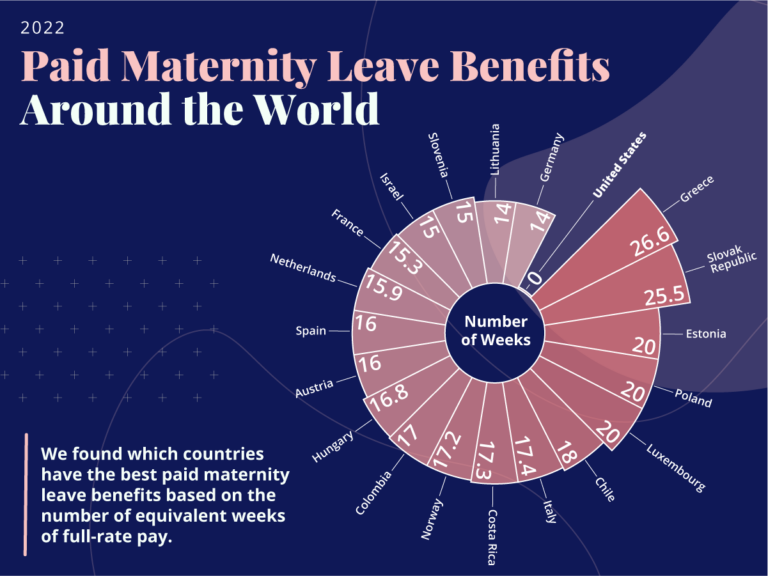
- The above describes the maternity leave stats in the world.
- The United States till now doesn’t provide any maternity leave whereas the WHO has recommended 16 weeks of maternity leave.
- On the other hand, Greece provides the highest maternity leave by 26.2 weeks.
(Reference: app.leg.wa.gov)
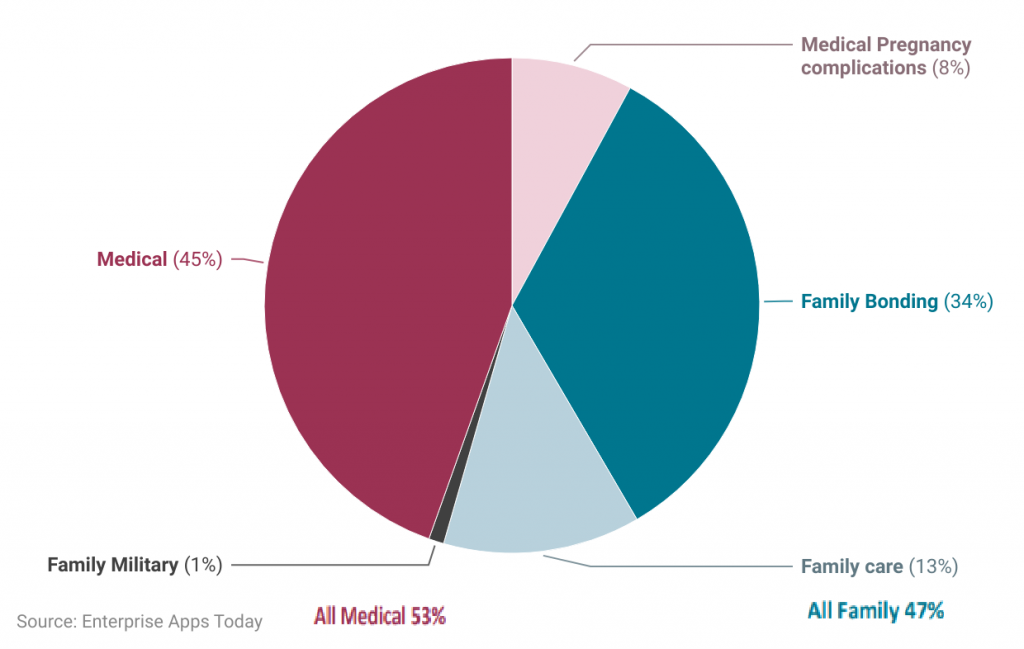
The chart above explains the types of PFL statistics of applications submitted by employees in Washington, in 2022.
- Bonding: January = 6,511, February = 5,360, March = 6,415, April = 6,142, May = 6,232, and June = 5,683
- Care: January = 2,341, February = 2,116, March = 2,452, April = 2,256, May = 2,472, and June = 2,424.
- Military: January = 16, February = 14, March = 13, April = 12, May = 16, and June = 15
- Medical: January = 8,821, February = 7,105, March = 8,225, April =7,681, May = 8,204, and June = 9,470
- Pregnancy: January = 1,455, February = 1318, March = 1,480, April = 1,508, May = 1,552, and June = 1,311
(Source: axios.com)

(Source: sgp.fas.org)
- The above graph represents the leave benefits stats that were available under State Leave Insurance Program in February 2023.
(Reference: usnews.com)
Paid Family Leave Application Approval Rates Statistics by Type:
- Bonding = 90%
- Care = 80%
- Military = 57%
- Medical = 81%
- Pregnancy = 81%
Paid Family Leave Statistics by Single and Married Women
- Single: Fully pay = 28%, Partial pay = 20%, and No pay = 52%
- Married: Fully pay = 34%, Partial pay = 33%, and No pay = 33%
Paid Family Leave Length Statistics by Age and Gender
- 18-39 years = 10.3 weeks
- 40 years and above = 8.3 weeks
- Female = 10.4 weeks
- Male = 8.3 weeks
- Non-binary = 8 weeks
Paid Family Leave Statistics by Demographics
- White Americans = 68%
- Hispanic / Latin = 16%
- Asia American = 10%
- African Americans = 7%
- Unknown = 4%
- American Indian = 2%
- Native = 2%
- Others = 2%
Paid Family Leave Statistics by states of U.S.
New York:
- Leave duration = 12 weeks/year.
- Qualifying reason = employees must have worked for 175 days or 26 consecutive weeks with 20 hours and above weekly.
- Contribution rate = 0.511% of employee wages.
- Benefit amount = 67% of weekly wage on average.
California:
- The paid family leave is part of its State Disability Insurance Program.
- Leave duration = 8 weeks/year.
- Contribution rate = 1.1% of employee wages.
- Qualifying reason = Eligible employees must attach to the labor market with sufficient earnings in the previous year.
- As of September 2022, the benefited amount = is 60-70% of the weekly salary approximately and by 2025 it is expected to reach 90% of the regular salary.
Rhode Island:
- As PFL is segmented into 2 parts that are TDI (Temporary Disability Insurance) and TCI (Temporary Caregiver Insurance). Thus the leave duration for both are different TDI = 30 weeks maximum and TCI = 5 weeks max.
- Qualifying reason = Before receiving the benefits employees must stay 7 days out of work.
- Contribution rate = 1.1% of employees' base wage that is max. $987.
Colorado:
- Leave duration = 12 weeks and more than 4 weeks in case of further medical complications as of 2022-23.
- For qualifying on PFL = employees have earned a $2,500 minimum from their respective job.
- Contribution rate = 0.9%, both employers and employees slip between them by 50/50.
- Benefit amount =Maximum $1,100 per week.
Connecticut:
- Leave duration = 12 weeks leaves and an additional 2 weeks for pregnancy recovery.
- Qualifying reason = In this state, both full and part-time employees must have earnings of $2,325 in the 1st quarter of earnings.
- Contribution rate = 0.5% of wages of employees.
- Benefit amount = 60 times of minimum wage.
Washington:
- Leave duration = 12 weeks minimum, 16 weeks for employees who have above one even qualification, and 18 weeks for childbirth.
- Qualifying reason = 820 hours of minimum worked time in the last year.
- Contribution rate = 0.6% of wages of employees.
- Benefit amount = $1,327 or weekly employee 90% of wages.
D.C:
- Employees' PFL duration depends on the particular reason for time off.
- Employees who have worked for an employer were qualified for PFL.
- Contribution rate = 0.62% wages of each employee.
- Benefit amount = $1,009 weekly.
New Jersey:
- Leave duration = 8 non-consecutive weeks and 12 consecutive weeks in a year.
- Qualifying reason = Weekly earnings of $240 within the last 20 weeks and a total of $12,000 in the first 4 quarters.
- Contribution rate = 0.14% wages of the employee.
- Benefit amount = $993 weekly in 2022.
Oregon:
- Leave duration = 12 weeks and can extend up to 2 more weeks for childbirth and others
- The payroll contribution begins on 1st January 2023 and employees will start receiving the benefit from 1st September 2023.
- Contribution rate = 1% share between 40% of employers and 60% of employees.
- Benefit amount = Almost 100% of wages.
Delaware:
- Leave duration = 12 weeks/year.
- Qualifying reason for PFL = employees must have worked min 1,250 hours in the last year.
- Contribution rate = 0.8% in total.
- Benefit amount = weekly 80% wages of an employee.
Maryland:
- Leave duration = Minimum 12 weeks and maximum 24 weeks if serious health condition of child, parents, or spouse.
- Qualifying reason for PFL = over 680 work hours in last 1 year also available for both full and part-time employees.
- Contribution rate = 1.2%
- Amount benefit = depends on wages of employees.
Paid Family Leave Statistics by Company Size
- 500 and above employees = 31%
- 100 – 499 employees = 22%
- 50 – 99 employees = 19%
- 1 – 49 employees = 13%
Paid Family Leave Statistics by Industries
- IT = 47%
- Finance and insurance = 40%
- Professional and technical services = 33%
- Health care and social assistance = 26%
- Educational services = 24%
- Professional and business services = 23%
- Real estate = 13%
- Leisure and hospitality = 9%
- Administrative and waste services = 8%
Paid Family Leave Statistics by Employees
- Workers of state and local government = 27%
- Civilian workers = 25%
- Workers of private industries = 24%
Paid Family Leave Statistics by Operating and Implementation Costs
- January, 2022 = > $50,000,000
- February = > $100,000,000
- March = < $ 50,000,000
- April = decreased from March
- May = $100,000,000
- June = < $ 50,000,000
- 2023 = $74,000,000
Paid Family Leave-Type Statistics by the Length of Leave
- Family bonding + pregnancy = 16.4 weeks
- Medical + family bonding = 14.7 weeks
- Family bonding = 9.1 weeks
- Medical = 8 weeks
- Family care = 6.9 weeks
Conclusion
As of now after summing up the overall statistics on Paid Family Leave it can be said that this policy resulted in benefits for employees and their families special parental leave for newly born. Important information has been concluded that the United States is not currently holding any national paid family leaves for employees who became new parents. PFL helps in enhancing family bonding, especially between child and parents also enables prompt health care facilities to parents. Hope the analysis above will help in better understanding the topic.
Sources
FAQ.
This is termed as Paid Family Leave which is applicable both for full and part time employees who passes some sort of eligibility criteria that depends on particular industry type of different countries.
Yes, obviously some amount of money from salary an employee’s need to invest on different program those are available in the particular country.
Payment benefits are available during the starting day of employees leave.

Barry is a lover of everything technology. Figuring out how the software works and creating content to shed more light on the value it offers users is his favorite pastime. When not evaluating apps or programs, he's busy trying out new healthy recipes, doing yoga, meditating, or taking nature walks with his little one.
