Walmart Statistics 2024 By Market Share, Revenue, Online Purchase Frequency, Total Number of Stores and Walmart+ Subscribers
Page Contents
- Introduction
- Editor’s Choice
- What is Walmart?
- General Walmart Statistics
- By Consumer Behaviour
- By Market Share in the USA
- By Online Purchase Frequency
- By Revenue
- By Country
- By Total Number of Stores
- By Net Sales by Product Category
- By Walmart+ Subscribers by Income Level
- By Brand Awareness
- By Net Sales by Division
- By Device Traffic
- Worldwide Retail Sales in the USA
- By Demographics
- By Share of Product Categories Purchased
- Conclusion
Introduction
One of the largest offline and online retailers Walmart is the everything under one roof retail store. After Amazon, people chose Walmart. It has millions of products in various categories. Today, Walmart stores are available in multiple countries and have more than 10,000 stores. According to Walmart Statistics, more than millions of consumers shop every day on the Walmart platform.
During the lockdown, Walmart served millions of households with essentials. It is not a joke, but Walmart generates billions of sales in just one day collectively from all the locations. Now, let’s get into the world of Walmart.
Editor’s Choice
- Walmart, the largest retail store, offers over 75 million products, with groceries constituting 55.7%.
- Average global consumer spending at Walmart reaches USD 15,288 per second.
- In the U.S., 2023 eCommerce market leaders are Amazon (37.8%), Walmart (6.3%), and Apple (3.9%).
- Projections for 2027 indicate Walmart's top-selling categories as Edible Grocery ($316.5 billion), Electricals ($88.9 billion), and Home & DIY ($67.1 billion).
- Mexico leads in Walmart international store count with 2,862 locations as of January 2023.
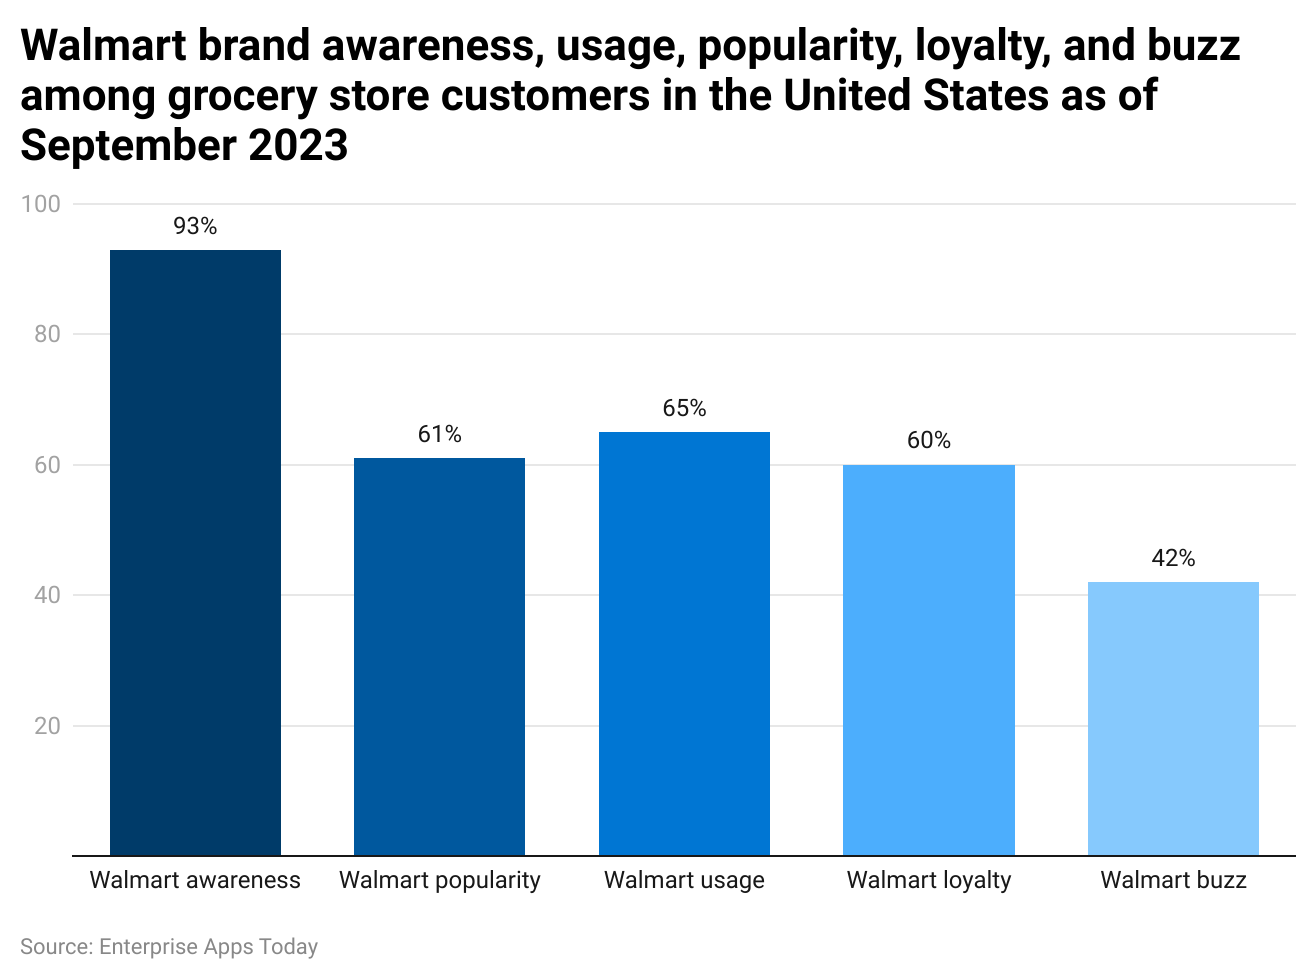
- About 93% of Americans are aware of Walmart as of September 2023, with a 61% popularity rate and a 65% visitation rate.
- Each Walmart store averages 10,000 daily customers, totaling 37 million customers globally.
- Walmart employs approximately 2.1 million associates worldwide, including 1.6 million in the U.S. as of 2023.
- 90% of Walmart shoppers reside within a 15-minute drive of a store.
- Bananas rank as Walmart's top-selling perishable item, with over 1.5 billion pounds sold annually.
What is Walmart?
Walmart Inc. is an American multinational retail company headquartered in Bentonville Arkansas. It was founded in 1962, by Sam Walton and Bud Walton. As of today, in more than 10,000 locations across the world. Walmart has all under one roof categories which include, groceries, drink, food, footwear, clothing decor, furniture, accessories, jewelry, beauty products, movies, books, games, electronics appliances, tools, pharmacy, photo center, hygiene products, musical instruments, toys, sporting goods school and office supplies, gardening tools, and auto center.
Global eCommerce, Walmart International, Walmart US, and Sam’s Club are divisions of Walmart. Walmart is one of the largest retail companies that also offers its services online for doorstep deliveries.
General Walmart Statistics
- Walmart has its stores in 24 countries and operates in more than 10,622 locations.
- As of 2023, Walmart employed around 2.1 million associates around the world, out of which 1.6 million are located in the United States of America.
- According to Walmart Statistics, every day this retail store collectively generates more than $1.5 billion in revenue.
- In the United States of America, Walmart has around 4,717 US-based locations, while 5,305 are located in international locations, and 600 stores are Sam's Club Stores.
- On average, Walmart is visited by 10,000 customers every day in just one store. Counting to this, globally it has become 37 million customers.
- According to Walmart Statistics by-products, this largest retail store sells more than 75 million varied products, of which 55.7% are grocery items.
- Bananas are all-time best-selling in the perishable food category, selling more than 1.5 billion pounds every year.
- As of 2023, online retail sales of Walmart touched $82.1 billion.
- As stated by Walmart Statistics, every distribution of this largest retail store is 1 million square feet and has more than 600 employees unloading and shipping 200 trailers every day.
- The all-time top 10 best-selling items of Walmart other than bananas are Toilet paper, slow cookers, televisions, Google Chromecast, Flushable Wipes, Disposable Washcloths, Paper Towels, Insulated Tumblers and Pillows.
- As of 2023, Walmart recorded 240 million weekly customer visits from around the globe.
- As of October 2023, Walmart.com generated 448.84 million of global traffic, whereas it was 415.35 million in September and in August 337.26 million.
- The majority of the employees at Walmart are female contributing 54.5% and male employees are 45.5%.
- The average salary of a Walmart employee is $77,661 a year.
- According to the Customer Satisfaction Index Score on a 100-point scale, in 2023, it has reached 70.
- On average, an employee makes $14.76 per hour.
By Consumer Behaviour
- 95% of Americans visit Walmart at least twice every year.
- 90% of the consumers who shop at Walmart live only 15 minutes away from Walmart stores.
- Surprisingly, considering the worldwide locations, on average consumers spend $15,288 every second.
- Americans who shops in different locations, 13.5% of which is spent at Walmart shopping.
- A typical Walmart shopper is likely to go to Walmart 63 times a year and buy 13 different products on every visit.
- On average, for every visit, a Walmart Shopper spends around $54 per trip, including on fruits, sweets, chicken, groceries, and packaged food
- On average, a family of 4 spends around $4,000 on shopping at Walmart every year.
- 1 out of every 4 dollars is spent on groceries by Americans.
- The most visited Walmart store is located at Telenav.
The following table displays the market share of the top retail e-commerce companies in the US as of 2023:
| Company | E-Commerce Market Share |
| Amazon | 37.8% |
| Walmart | 6.3% |
| Apple | 3.9% |
| eBay | 3.5% |
| Target | 2.1% |
| The home depot | 2.1% |
| Best buy | 1.6% |
| Costco | 1.6% |
| Carvana | 1.5% |
| Kroger | 1.4% |
| Wayfair | 1.1% |
| Chewy | 1% |
| Macy’s | 0.9% |
| Lowe’s | 0.9% |
| Qurate Retail Group | 0.7% |
(Source: demandsage.com)
As of 2023, in the United States of America, the largest retail stores with the highest eCommerce market share are Amazon (37.8%), Walmart (6.3%), and Apple (3.9%).On the other hand, Macy’s, Lowe’s, and Qurate Retail Group have less than 1% market share.
By Online Purchase Frequency
This table shows Walmart consumers’ online purchase frequency:
| Walmart Consumer’s Purchase Frequency | Share Of Respondents |
| More often than once a day | 9% |
| Once a day | 11% |
| 4 to 6 times a week | 17% |
| 2 to 3 times a week | 16% |
| Once a week | 13% |
| 2 to 3 times a month | 17% |
| Once a month or less | 15% |
| I have never shopped online | 1% |
(Source: yaguara.co)
17% of the shoppers generally visit Walmart 2 to 3 times a month, with 16% 2 to 3 times a week. There are around 15% Americans who only go to Walmart stores once a month or even less. Considering the overall brand awareness, 1% of Americans have never gone to this largest retail store. Surprisingly, there are 9% of consumers who go to Walmart more than once a day.
By Revenue
The following table displays the estimated net sales of Walmart according to the category in 2022 and 2027:
| Category | 2022 | 2027 |
| Edible grocery | 271.8 billion | 316.5 billion |
| Electricals | 74.8 billion | 88.9 billion |
| Home and DIY | 54.8 billion | 67.1 billion |
| Leisure and entertainment | 43.5 billion | 50.5 billion |
| Fashion and Apparel | 38.6 billion | 44.9 billion |
| Household and Petcare | 35.7 billion | 41.9 billion |
| Health and beauty | 23 billion | 27.9 billion |
| Other | 22.3 billion | 26.9 billion |
| office | 12.7 billion | 15.3 billion |
| Food Service | 5.2 billion | 5.9 billion |
(Source: demandsage.com)
In 2022, the top 3 product categories with the highest net sales were Edible grocery, Electricals, and Home and DIY with $271.8 billion, 74.8 billion, and 54.8 billion respectively. Furthermore, by 2027, Walmart Statistics project that these categories will remain the highest-selling category, resulting in $316.5 billion (Edible grocery), 88.9 billion (Electricals), and Home and DIY (67.1 billion).
By Country
(Source: statista.com)
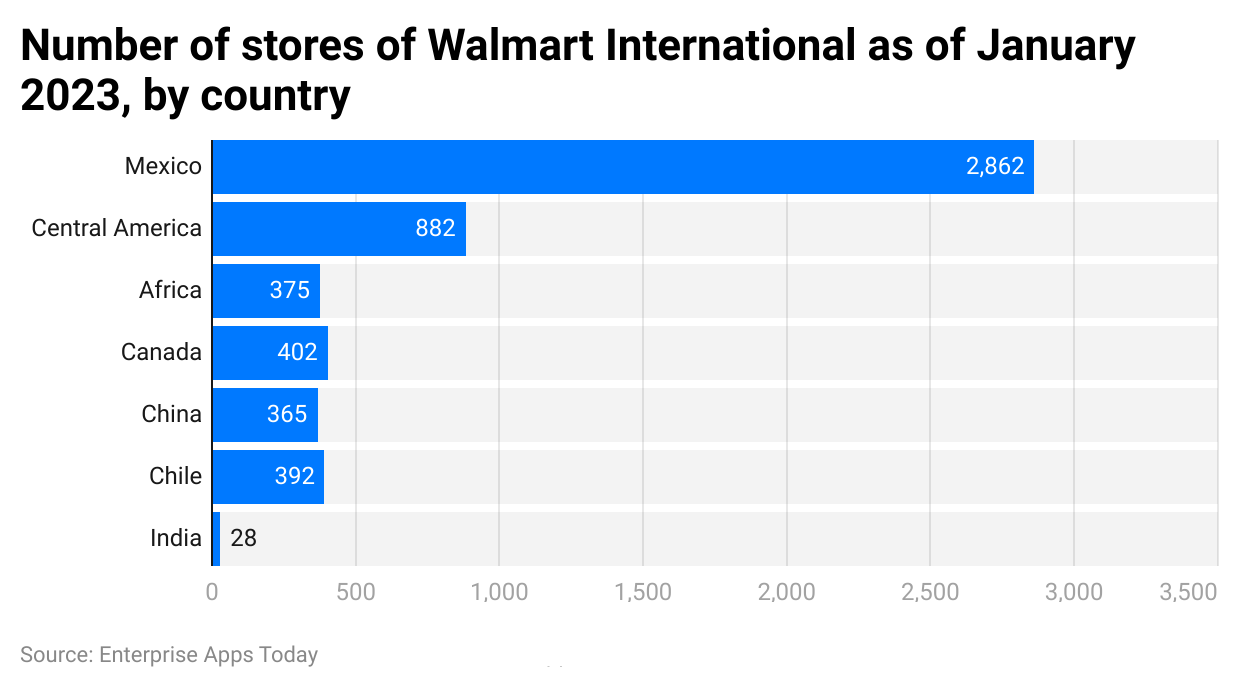
Considering all international locations, Mexico has the highest number of Walmart stores resulting in 2,862 as of January 2023. Other countries with the highest scores are Central America (882), and Africa (375). However, India has only 28 stores as of 2023.
By Total Number of Stores
| State | Number of Walmart Locations | Percentage of Total U.S. Stores |
|---|---|---|
| Texas | 601 | 11.20% |
| Florida | 386 | 7.20% |
| California | 321 | 5.99% |
| North Carolina | 216 | 4.03% |
| Georgia | 215 | 4.01% |
| Illinois | 190 | 3.54% |
| Ohio | 174 | 3.25% |
| Pennsylvania | 163 | 3.04% |
| Missouri | 158 | 2.95% |
| Virginia | 151 | 2.82% |
(Source: zippia.com)
In 2023, the top three states in the USA with the highest number of stores are Texas (601), Florida (386), and California (321) which have captured the total US stores market by 11.20%, 7.20%, and 5.99% respectively.
By Net Sales by Product Category
(Source: statista.com)
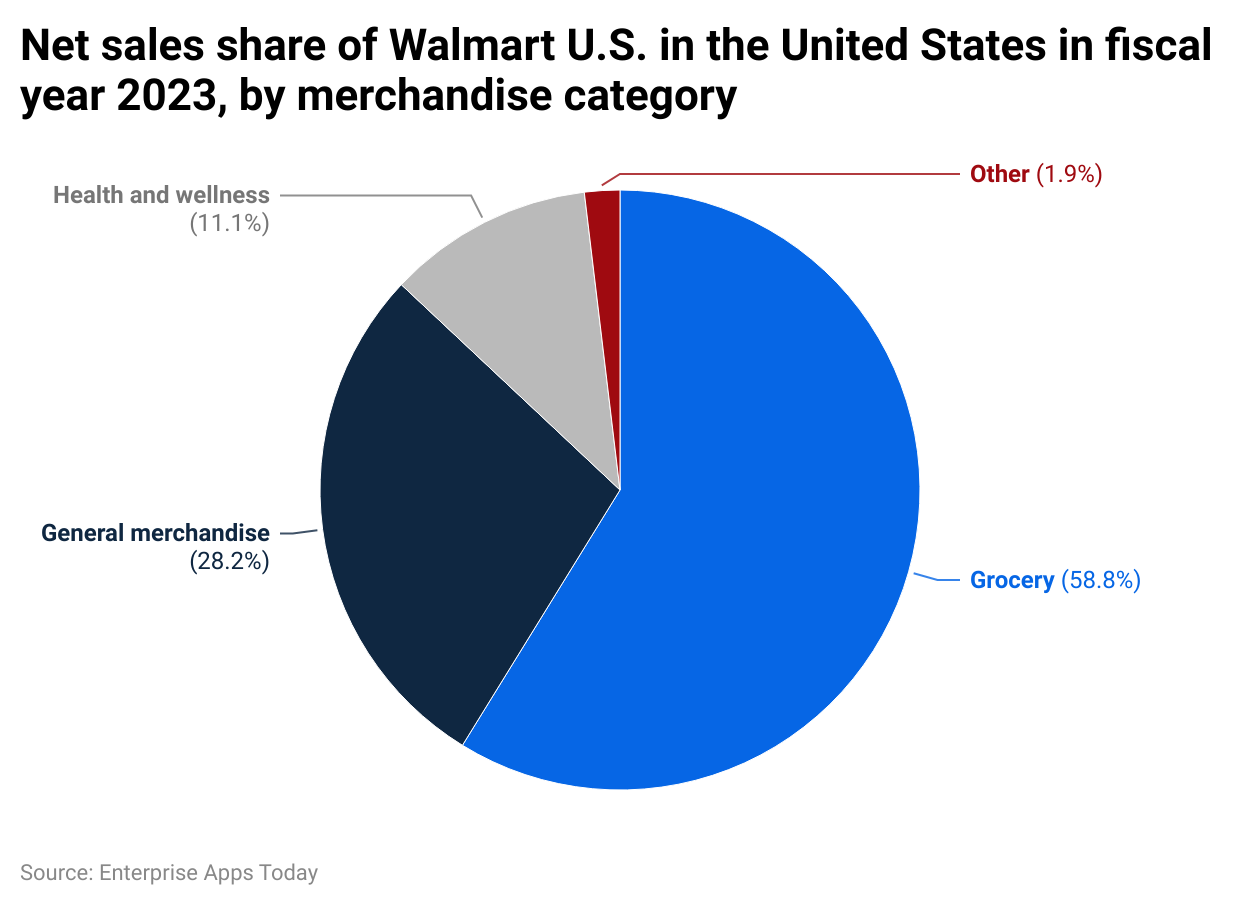
In Q1 of 2023, the highest-selling product category, resulted in 58.8%, followed by General merchandise (28.2%) and Health and Wellness products (11.1%).
By Walmart+ Subscribers by Income Level
(Source: statista.com)
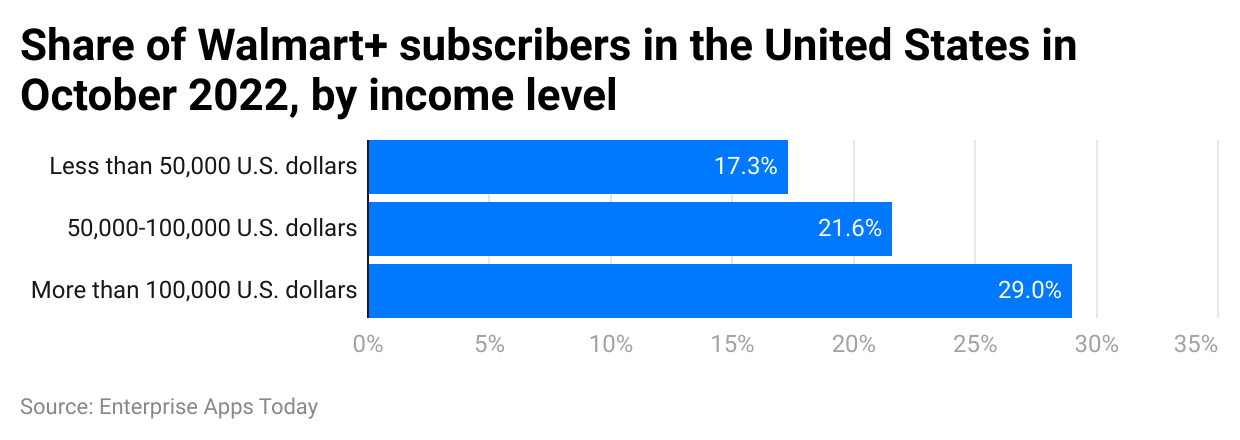
As of October 2022, there are 29% of the consumers with more than $100,000 income p.a who are subscribed to Walmart+. Furthermore, consumers with less than $50,000 income contribute 17.3% and 21.6% belong to the $50,000 to $100,000 income group.
By Brand Awareness
(Source: statista.com)
As of September 2023, around 93% of Americans knew about the brand Walmart. In 61% of them, the brand is popular, but people who visit the retail store are 65%. More than half of the consumers are loyal to Walmart resulting in 60% and 42% of all buzzing about it.
By Leading Stores Brand Awareness
(Source: statista.com)
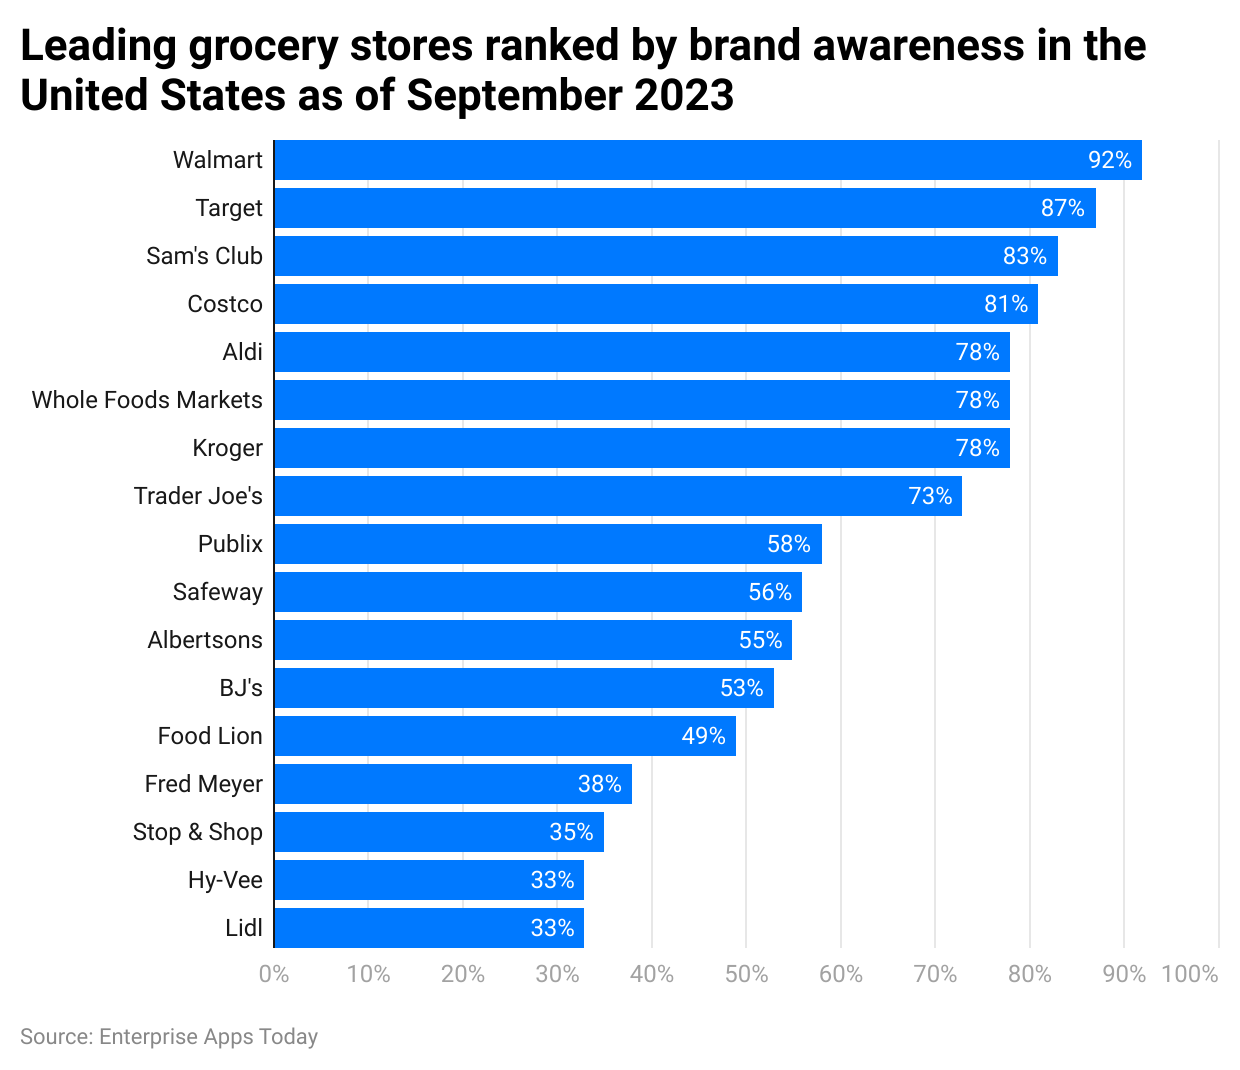
As of 2023, the top 5 leading grocery stores in the United States of America are Walmart (92%), Target (87%), Sam’s Club (83%), Costco (81%) and Aldi (78%). Many others with greater brand awareness are Kroger, Safeway, Publix, Safeway, Albertsons and much more.
By Net Sales by Division
(Source: statista.com)
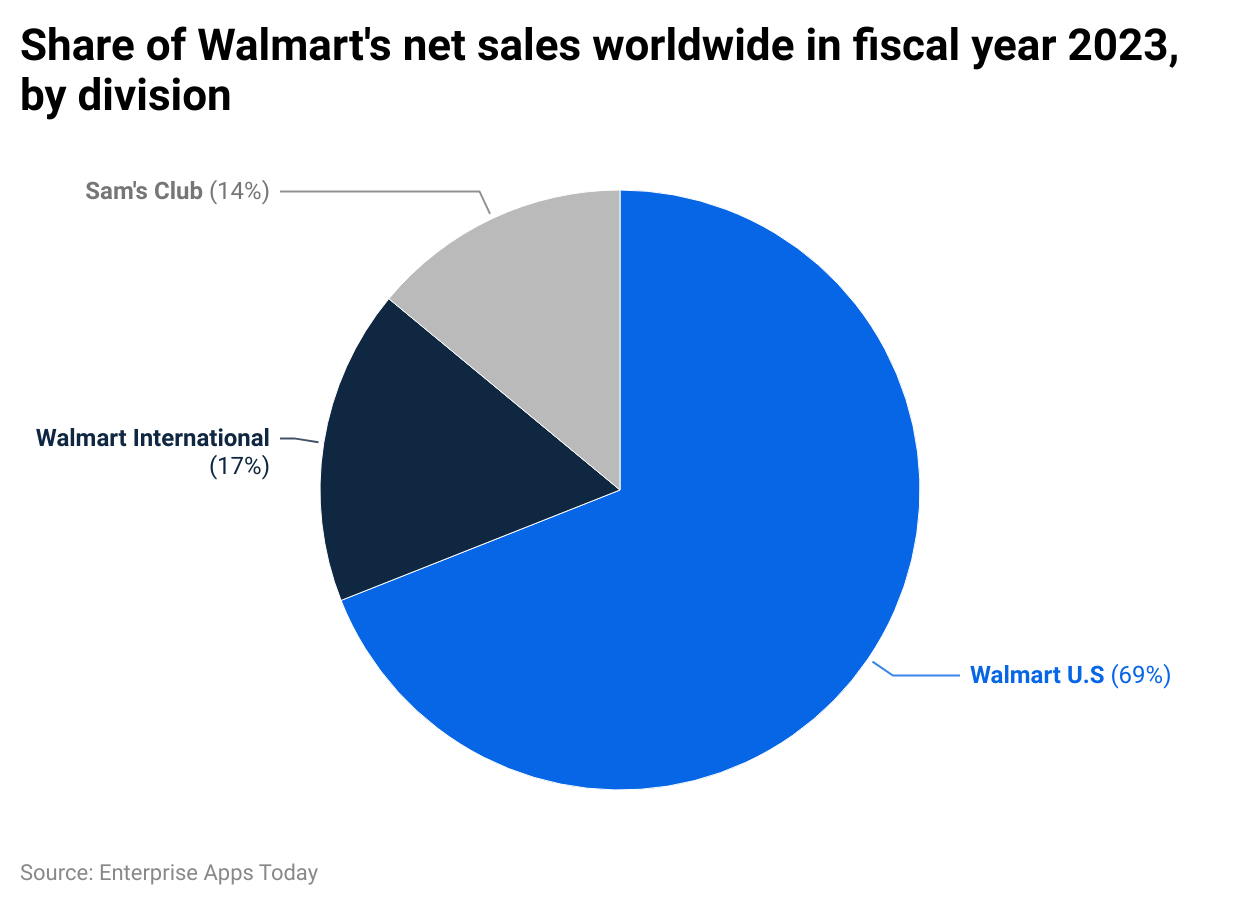
According to Walmart Statistics, the highest number of net sales from global divisions is generated by Walmart U.S. resulting in 69%, followed by Walmart International (17%), and Sam’s Club (14%).
By Device Traffic
(Source: semrush.com)
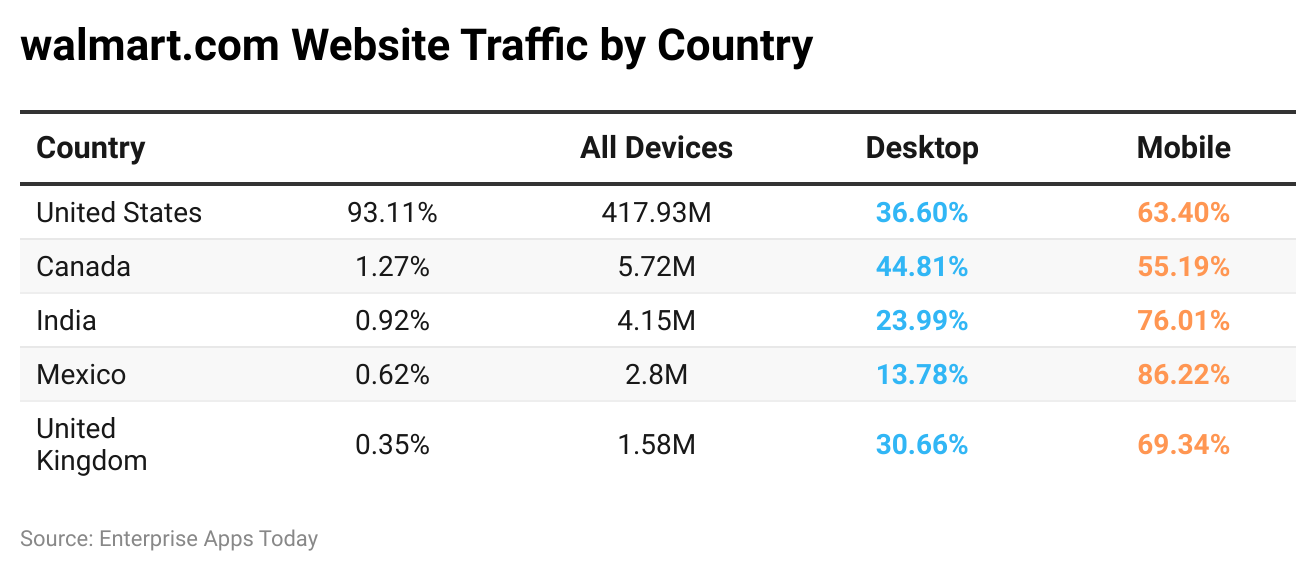
Over the last 6 months of 2023, the majority of the e-commerce traffic of Walmart is generated from mobile devices. 63.66% of traffic and 36.34% are generated by mobile and desktop respectively. Overall devices that contributed to traffic are desktop (14 million) and mobile (28 million).
Worldwide Retail Sales in the USA
(Source: statista.com)
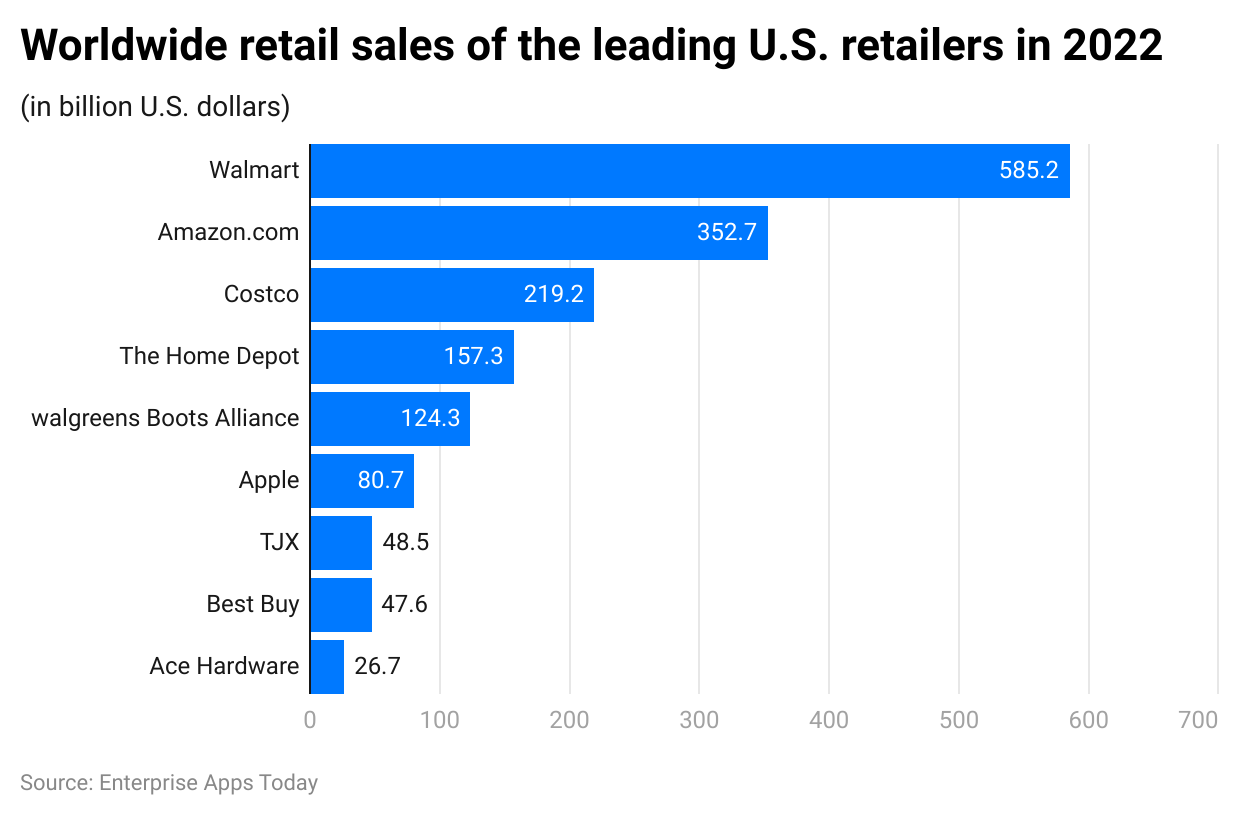
As of 2022, in the United States of America, Walmart generated the highest number of retail sales resulting in $585.2 billion, followed by Amazon.com (352.7 billion), and Costco ($219.2 billion). Whereas, other brands with the least leading net sales are TJX ($48.5 billion), Best Buy ($47.6 billion), and Ace Hardware ($26.7 billion).
By Demographics
By Age
(Source: statista.com)
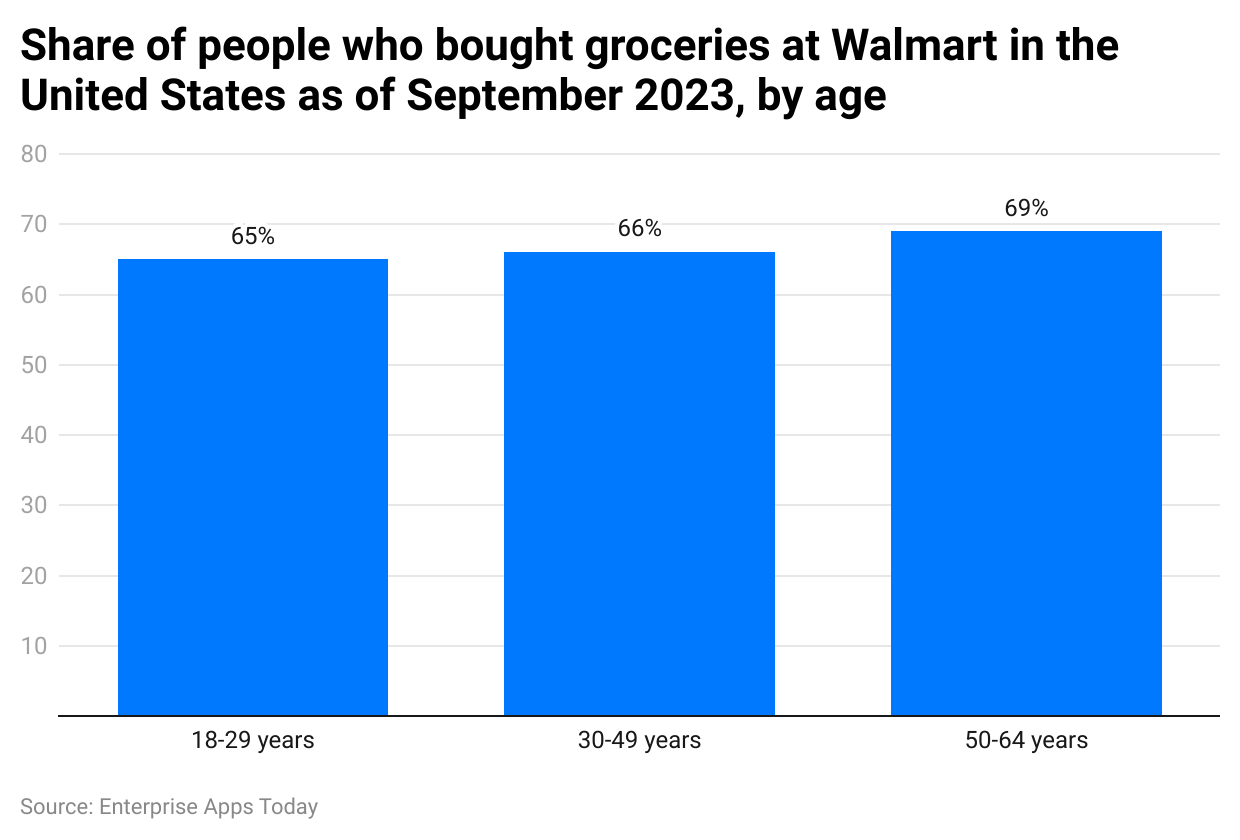
As of September 2023, the majority of the consumers that bought groceries were aged between 50 to 64 years resulting in 69%, followed by 30 to 49 years (66%) and 18 to 29 years (65%).
By Employee’s Ethnicity
This table shows Walmart’s employees by Ethnicity:
| Ethnicity | Percentage Of Employees |
| White | 62.5% |
| Black | 12.9% |
| Hispanic | 15.2% |
| Asian | 6% |
| Alaska Native/Native American | 1.13% |
| Pacific Islander/Native Hawaiian | 0.5% |
(Source: yaguara.co)
The majority of the employees are white resulting in 62.5%, followed by black (12.9%), and Hispanic (15.2%). The workforce of Walmart is unique and includes everyone from each ethnicity.
This table shows the top product categories purchased by Walmart Consumers:
| Product Category | Percentage Of Buyers |
| Groceries | 53% |
| Clothing | 44% |
| Beauty and Personal Care | 40% |
| Cleaning Supplies | 39% |
| Vitamins and Dietary supplements | 32% |
| Pet Supplies | 31% |
| Electronics | 26% |
| Over-the-counter medicine | 26% |
| Home and Kitchen | 25% |
| Toys and games | 22% |
| Arts, crafts, and sewing | 21% |
| Office Supplies | 18% |
| Garden and outdoor | 17% |
| Baby products | 15% |
| Books | 15% |
| Alcohol | 15% |
| Automotive Parts and accessories | 14% |
| Exercise/fitness supplies | 14% |
| Tobacco, Pipes, and accessories | 11% |
(Source: yaguara.co)
Groceries (53%), Clothing (44%) Beauty, and personal care products (40%) are the all-time top 3 most preferred categories to buy at Walmart. However, the least purchased category is given to Alcohol (15%), Automotive Parts and accessories and Exercise/ fitness supplies(14%), and Tobacco, Pipes, and accessories (11%).
Conclusion
With an increasing trend in eCommerce and shopping under one roof, Walmart has been successful in capturing the majority of the market in the United States of America. Day by day, Walmart is growing its revenue and market share. In the coming years, the total number of retail stores will be spread across more countries.
Walmart Statistics have proven how big this retail company has captured the market. Today, Walmart is not limited to Walmart US only, but it has widespread operations all over the world. With this rising growth in sales, demand, and revenue, Walmart may become dominant in the e-commerce and retail market in the coming years.
Sources
FAQ.
The descendants of Sam Walton's family is the owner of Walmart who own 50% of the share in the company.
Yes. Orders can be made online for express deliveries under 1 hour. Most of the items are available to purchase at the same price as in the stores.
Walmart+ is a subscription-based membership service that offers benefits to consumers such as free deliveries from stores, Walmart rewards, mobile scan and Go, free shipping on no minimum order, early access to events and promotions, video streaming with Paramount+, and savings on fuel. The membership fee of the same is $98/ year and $12.95/ month.

Barry is a lover of everything technology. Figuring out how the software works and creating content to shed more light on the value it offers users is his favorite pastime. When not evaluating apps or programs, he's busy trying out new healthy recipes, doing yoga, meditating, or taking nature walks with his little one.


