Black Friday Vs Cyber Monday Statistics 2023 – By Spending, Shopping Place, Total Sales, Type of Store
Page Contents
- Introduction
- Editor’s Choice
- General Black Friday Statistics
- General Cyber Monday Statistics
- Black Friday Vs Cyber Monday Statistics
- Black Friday Vs Cyber Monday Statistics by Spending
- Black Friday Vs Cyber Monday Statistics by Shopping Place
- Black Friday Vs Cyber Monday Statistics by Reasons for Dissatisfaction During the Shopping
- Black Friday Vs Cyber Monday Statistics by Total Sales in 2023
- Black Friday Vs Cyber Monday Statistics by Type of Store
- Black Friday Vs Cyber Monday Statistics by the rate of discount by Category
- Black Friday Vs Cyber Monday Statistics by ways shoppers become aware of the deals
- Black Friday Vs Cyber Monday Statistics by Demographics
- Conclusion
Introduction
Black Friday Vs Cyber Monday Statistics: This year 2023, generated record-breaking shopping numbers on various eCommerce websites. Even though there are prices of gas, grocery items, house rent, and other regular expenses, people still enjoy seasonal shopping trends during BFCM season. With recent rising trends of eCommerce shopping, in 2023 the majority number of Americans chose to shop online. The craze to stand in line and wait until you enter the store has reduced in the last few years. These Black Friday Vs Cyber Monday Statistics tell us the shopping trends of 2023 that occurred during the BFCM week.
Editor’s Choice
- Considering the BFCM weekend, Black Friday was the biggest day for in-store purchases which resulted in 76.2 million shoppers.
- According to Black Friday Vs Cyber Monday Statistics, around 164 to 174 million Americans shop during these seasons. However, the shopping starts from Thanksgiving.
- In 2023, during BFCM week, the conversion rates on mobile phones were lower as compared to desktops.
- During the BFCM season, online sales growth increased by 9% whereas in-store sales accounted only for 1.1% in 2023.
- According to Black Friday Vs Cyber Monday Statistics, the highest number of consumers were not satisfied with their shopping experience because of non-attractive discounts resulting in 59%
- As of 2022, the number of shoppers online exceeded the number of in-store shoppers. Starting from Thanksgiving to Cyber Monday, almost 50% in every case chose to shop online.
- As of 2023, in the United States of America, the highest observed sales were generated on Black Friday resulting in $16.4 billion, which has shown a year-on-year growth of 9%.
- During the BFCM season (Black Friday, Cyber Monday), in 2022, the total season revenue broke the record by generating $211.7 billion of revenue.
- On average, between black Friday and Cyber Monday, an American plans to spend around $500 on shopping.
- In addition, a record-breaking 200.4 million Americans shopped during BFCM weekend.
General Black Friday Statistics
- In 2022, 87.2 million shoppers in the United States of America shopped on Black Friday.
- In a similar year as above, the average spend on highest on Cyber Monday as compared to Black Friday resulting in $218 and $205 respectively.
- In 2022, on average by the end of October, shoppers in the United States of America spent 23% of their holiday shopping budgets.
- During 2022, the majority of the consumers spent on clothing, shoes, and accessories resulting in 53%, followed by electronics (49%) and toys (35%).
- In 2022, on average $357 was spent per person by Gen Z being the top Black Friday shoppers.
- As of 2023, the most preferred destination to go shopping is Kohl’s resulting in 41% as stated by Americans.
- According to Black Friday Statistics, 62% of Americans think discounts during this season are just big scams.
- As of 2023, around 23% of consumers are said to be spending more than $1,000 on holiday shopping.
- In 2022, the majority of the consumers went to shop on Friday between 5 am to 10 am resulting in 29%.
- Black Friday Statistics state that, the following percentage of consumers are willing to stand in a queue to enter stores: More than 2 hours (11%), 1 to 2 hours (18%), 30 to 60 minutes (26%), and less than 30 minutes (45%).
General Cyber Monday Statistics
- As of 2023, the Cyber Monday growth in sales is observed by 9.6%.
- During 2022, the most preferred shopping destinations for Cyber Week in the USA were online and department stores 42%, – Grocery stores and supermarkets- 40%, clothing and accessories stores – 36%, and discount stores – 32%.
- During Cyber Week of 2022, 90% of Americans agreed that the provided number of deals or discounts was the same or better than the previous year.
- During Cyber Monday 2022, the electronic segment was the most preferred category for spending holiday budget by Americans resulting in 43% followed by clothing and accessories (42%) and toys (31%).
- Similar to Black Friday's favorite destination shopping center, on Cyber Monday 33% of people choose to visit Kohl’s.
- During 2023 Cyber Week, Promotions/ Sales (81%) were the top reasons that affected the purchase decision followed by free shipping (80%) and availability of products (66%).
Black Friday Vs Cyber Monday Statistics
- According to Black Friday Vs Cyber Monday Statistics, around 164 to 174 million Americans shop during these seasons. However, the shopping starts from Thanksgiving.
- In 2022, 43% of consumers chose electronic products on Cyber Monday.
- Between Black Friday and Cyber Monday, around 200 million consumers shopped in-store.
- During the BFCM season (Black Friday, Cyber Monday), in 2022, the total season revenue broke the record by generating $211.7 billion of revenue.
- During Cyber Week, 76% of the shopper’s traffic came from mobile devices.
- Furthermore, 53% of Americans purchased shoes, clothing, and accessories on Black Friday, while others (49%) purchased electronics and toys (39%).
- Black Friday Vs Cyber Monday Statistics stated that, in 2022, there were more shoppers during this season as compared to the previous year.
- On average, between black Friday and Cyber Monday, an American plans to spend around $500 on shopping.
- 74% of shoppers spread across the world, who shop between these seasons, said they get better deals online as compared to in-store shopping.
- According to Black Friday Vs Cyber Monday Statistics, 4 out of 5 businesses run campaigns during these seasons.
- During the BFCM season, online sales growth increased by 9% whereas in-store sales accounted only for 1.1% in 2023.
- In addition, a record-breaking 200.4 million Americans shopped during BFCM weekend.
- Out of which, 134.2 million people were seen shopping on various eCommerce websites.
- Considering the BFCM weekend, Black Friday was the biggest day for in-store purchases which resulted in 76.2 million shoppers.
- According to Black Friday Vs Cyber Monday Statistics, the majority of the footfall in stores was observed in the afternoon between 2 pm to 3 pm.
- Furthermore, 78% of the shoppers purchased for Small Business Saturday.
- In 2023, during BFCM week, the conversion rates on mobile phones were lower as compared to desktops.
- In 2023, compared to 2022, the markets observed 35% growth in businesses offering discounts.
- As per the Black Friday Vs Cyber Monday Statistics, the rising cost of living is the major reason given by 78% of consumers along with increased costs of groceries (67%), and high inflation (60%) for spending less on holiday seasons in 2023
Black Friday Vs Cyber Monday Statistics by Spending
(Source: statista.com)
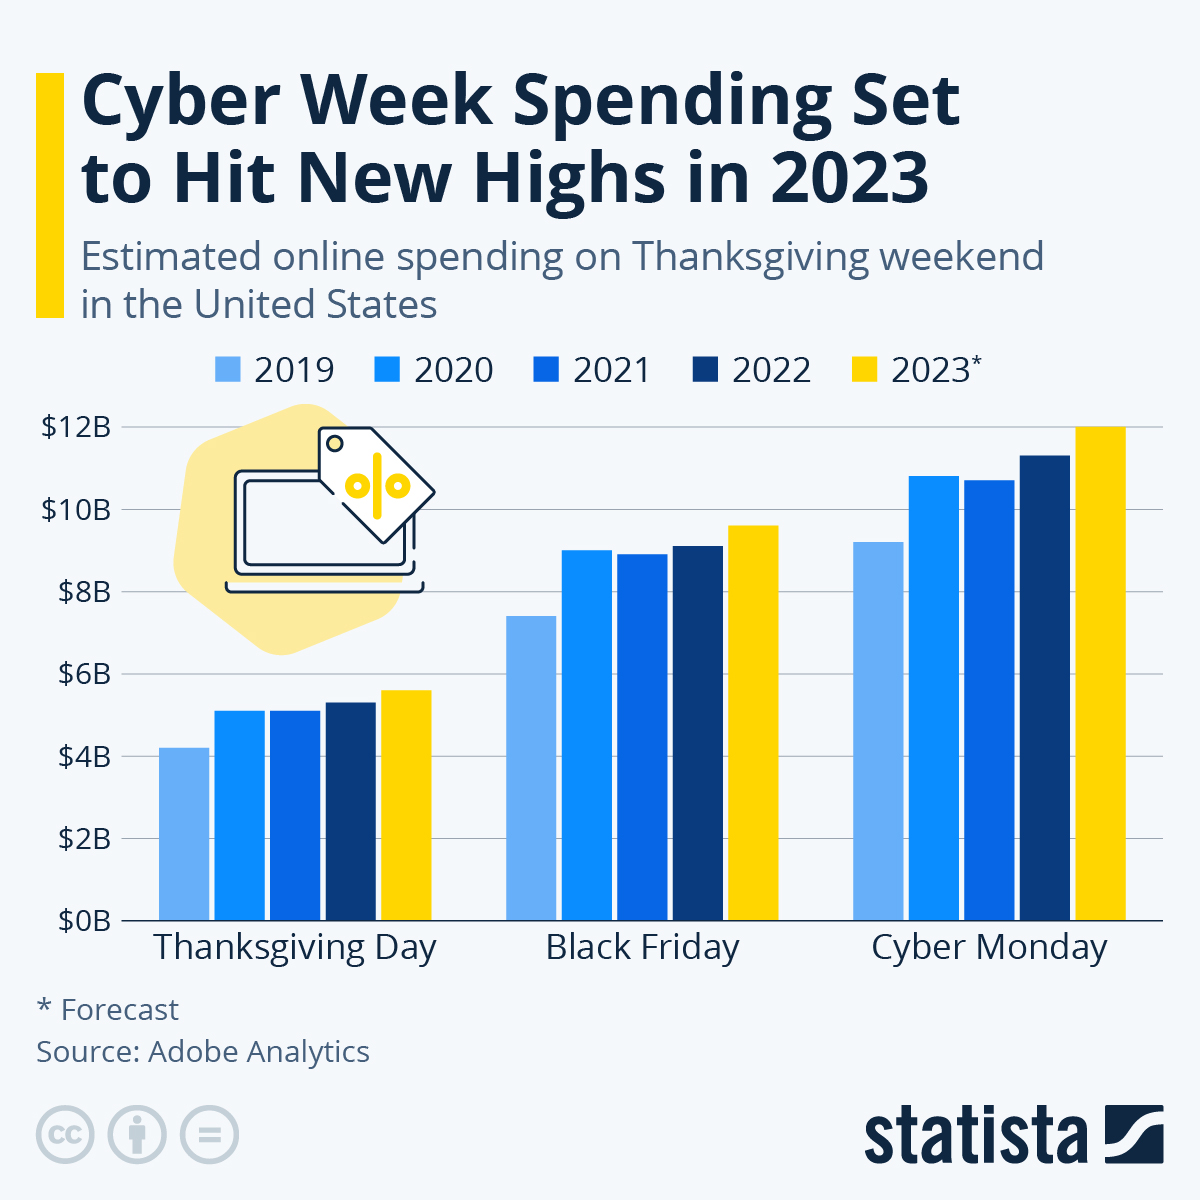
As studied by Black Friday Vs Cyber Monday Statistics, in 2023, during Cyber Week of 2023, the forecast of online spending was projected to break the previous year's records, occurring on Cyber Monday, Black Friday, and Thanksgiving. According to reports, Cyber Monday is expected to be the biggest shopping season out of the above-mentioned, resulting in $12 billion in eCommerce spending. Similarly, on Black Friday, the projected spending is $9.6 billion, and $5.6 billion for Thanksgiving sales.
Black Friday Vs Cyber Monday Statistics by Shopping Place
- Thanksgiving: 17.2 million in-store / 36.2 million online.
- Black Friday: 66.5 million in-store / 88.0 million online.
- Small Business Saturday: 51.0 million in-store / 56.4 million online.
- Sunday: 24.6 million in-store / 39.3 million online.
- Cyber Monday: 20.3 million in-store / 77.0 million online.
(Source: explodingtopics.com)
As of 2022, the number of shoppers online exceeded the number of in-store shoppers. Starting from Thanksgiving to Cyber Monday, almost 50% in every case chose to shop online.
Black Friday Vs Cyber Monday Statistics by Reasons for Dissatisfaction During the Shopping
(Source: explodingtopics.com)
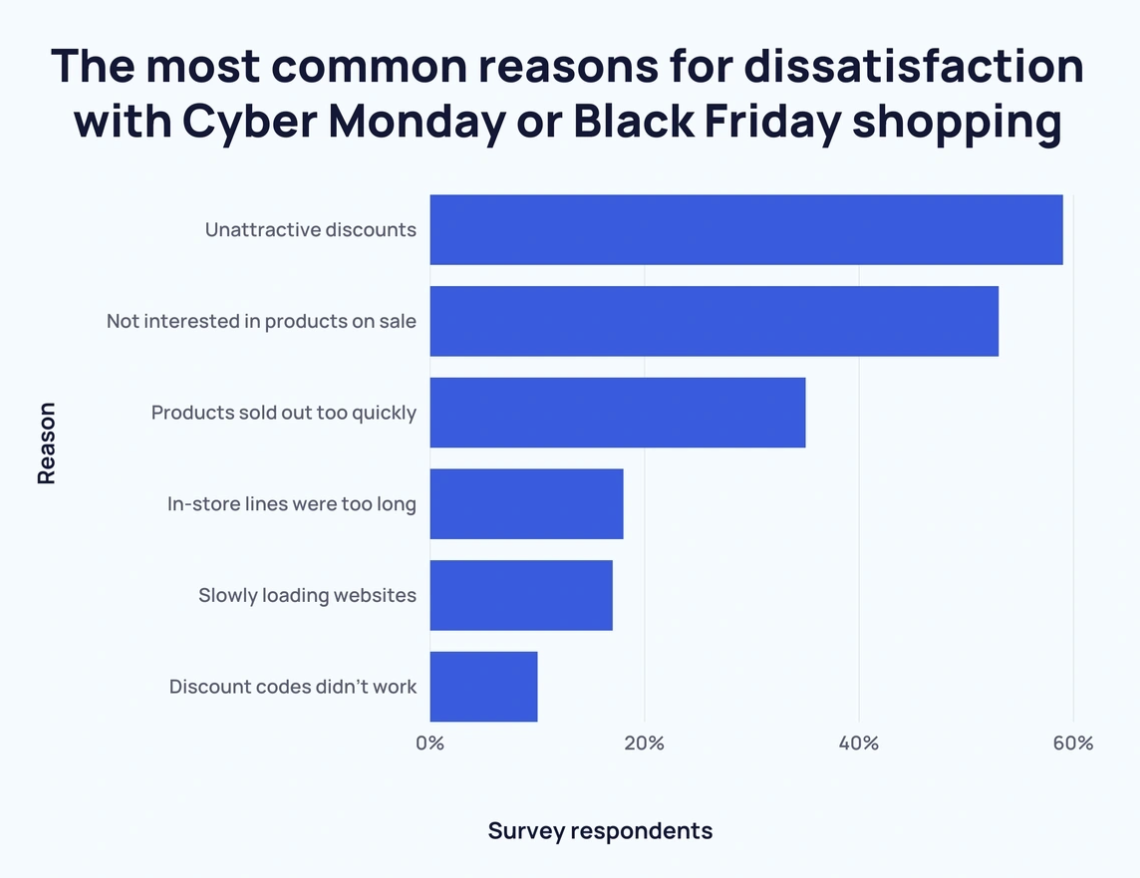
According to Black Friday Vs Cyber Monday Statistics, the highest number of consumers were not satisfied with their shopping experience because of non-attractive discounts resulting in 59%. Furthermore, 53% and 35% of shoppers said, they were interested in product sales, and the products they wanted to purchase were sold out too quickly. Whereas, 18% of shoppers said the in-store queues were too long, added by 17% stated the slowness of website loading time. 10% of the Americans said discount codes didn’t work for them.
Black Friday Vs Cyber Monday Statistics by Total Sales in 2023
Total BFCM Online Sales Results (US)
|
Day
|
Sales Total
|
YoY Growth
|
|---|---|---|
|
Black Friday
|
$16.4B
|
9%
|
|
Cyber Monday
|
$12.6B
|
3%
|
|
Cyber Week
|
$70.8B
|
5%
|
(Source: fitsmallbusiness.com)
As of 2023, in the United States of America, the highest observed sales were generated on Black Friday resulting in $16.4 billion, which has shown a year-on-year growth of 9%, followed by Cyber Monday with $12.6 billion in sales and 3% YoY growth. During the entire Cyber week, the total generated sales were $70.8 billion in the USA resulting in 5% YoY growth.
Black Friday Vs Cyber Monday Statistics by Type of Store
- Online: 44%
- Grocery stores and supermarkets: 42%
- Department stores: 40%
- Clothing and accessories stores: 36%
- Electronics stores: 29%
(Source: fitsmallbusiness.com)
In 2023, majority of the Americans shopped online resulting in 44%. On the other hand, only 29% chose to visit electronics stores. In addition, other types of stores visited by shoppers in the USA are grocery stores and supermarkets (42%), Department stores (40%), and clothing and accessories stores (36%).
Black Friday Vs Cyber Monday Statistics by the rate of discount by Category
|
Day
|
Discount
|
|---|---|
|
Thursday, November 23
|
Electronics: 26.7%
Toys: 28.2%
Apparel: 22.7%
Average: 25.87%
|
|
Friday, November 24
|
Electronics: 26.9%
Toys: 28%
Apparel: 24.2%
Average: 26.37%
|
|
Saturday, November 25
|
Electronics: 27.1%
Toys: 27.4%
Apparel: 23.7%
Average: 26.07%
|
|
Sunday, November 26
|
Electronics: 27.5%
Toys: 26.1%
Apparel 22.4%
Average: 25.33%
|
|
Monday, November 27
|
Electronics: 31.4%
Toys: 27.1%
Apparel: 23.4%
Average: 27.3%
|
(Source: fitsmallbusiness.com)
The BFCM week of 2023, observed a pretty good amount of deals in most preferred categories of products. However, on Monday, November 27th, the average discount compared to other days was more resulting in 27.3%. With minor differences in discounts, the lowest was given on Sunday, November 26th.
Black Friday Vs Cyber Monday Statistics by ways shoppers become aware of the deals
- Retailer promotional social media ads (47%)
- Word-of-mouth recommendations from family/friends (39%)
- Online blogs/articles (33%)
- Retailer apps/push notifications (30%)
- Retailer organic social media posts (21%)
- Newspapers/magazines (21%)
- TV/radio (20%)
- Influencers (18%)
- In-store advertisements (15%)
(Source: driveresearch.com)
During BFCM Weeks, consumers become aware of the deals and discounts through promotional social media ads resulting in 47% being the topmost source, followed by word-of-mouth recommendations from family and friends (39%) and online blogs or articles (33%). Surprisingly, the stores that offer discounts have the lowest rate in showcasing the deal contributing only by 15%.
Black Friday Vs Cyber Monday Statistics by Demographics
(Source: techreport.com)
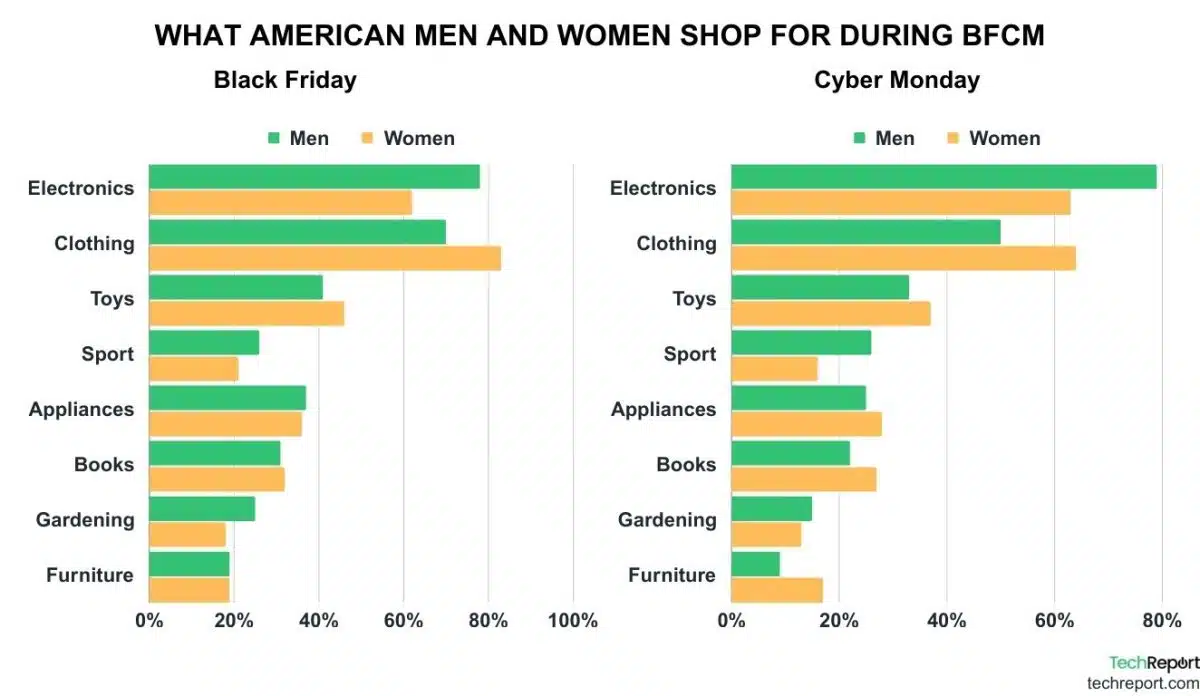
According to Black Friday Vs Cyber Monday Statistics, the most preferred items during the BFCM season by men and women are Electronics, clothes, and toys. According to reports, men are more likely to shop during Black Friday resulting in 78% as compared to 62%. Furthermore, during Cyber Monday, men buy electronics (79%) compared to women with 64%.
Conclusion
Concluding Black Friday Vs Cyber Monday Statistics, this year Americans preferred to purchase online as compared to standing in a line outside a store. Furthermore, it was seen that electronics, clothing, and accessories were the top choices of consumers during BFCM week. However, even though consumers shop on eCommerce websites, there are still some consumers who enjoy in-store shopping but the rate for the same is decreasing year on year. Multiple factors define the decision to shop online or in-store during the seasons, and the rate of discounts or deals is one of the most influential factors.
Sources
FAQ.
Black Friday is celebrated on the Friday after Thanksgiving in the United States of America. Generally, this is the start of the Christmas shopping season in the USA.
Cyber Monday is the term used for online shopping or purchases that specifically occur on Mondays after Thanksgiving. During the entire week, all retailers and brands offer a great number of discounts and deals.
BFCM is celebrated every year after Thanksgiving. Black Fridays and Cyber Mondays are celebrated respectively.

Barry is a lover of everything technology. Figuring out how the software works and creating content to shed more light on the value it offers users is his favorite pastime. When not evaluating apps or programs, he's busy trying out new healthy recipes, doing yoga, meditating, or taking nature walks with his little one.


