Tableau: Business Intelligence Software Review
Page Contents
Business intelligence (BI) software is used by organizations to find patterns that can help them to improve their business outcomes.
See below to learn about BI software and what Tableau has to offer as a BI tool, in terms of features, integrations, benefits, use cases, users reviews and pricing:
Business intelligence software
BI software takes the mountain of data that a business generates across departments and collects and processes it for organization-wide insights and analysis.
Users can then carry out queries to find useful information on different criteria. BI software can display that relevant information in the form of attractive charts and reports. Many BI applications can also display dashboards that update the information in real-time.
Tableau suite
Tableau is a BI application that helps businesses to simplify processing and displaying business intelligence.
It is designed in such a way that it is easy for anyone to set up customized dashboards.
Tableau offers different tools to help you meet your needs:
-
Tableau Prep: allows users to combine, shape, and clean data with a visual interface. It also allows for the automation of data flows.
-
Tableau Desktop: offers data exploration through an intuitive interface.
-
Tableau Online: facilitates self-service analytics in the cloud.
-
Tableau Server: allows users to access Tableau data from a server instead of having to download files individually for use with Tableau Desktop.
-
Tableau Mobile: allows users to monitor important dashboards on their mobile devices.
Tableau BI features
Tableau’s feature set gives users several options for manipulating data:
-
Filtering of multiple data sources: allows users to filter across multiple data sources as long as the data has common dimensions.
-
Cross database: allows for the linking up of cross-departmental data, allowing for the easier construction of visualizations.
-
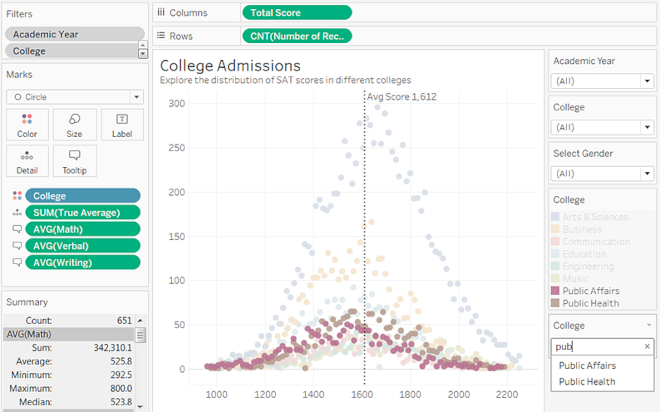
Data highlighter: allows users to quickly spot something they're looking for without changing context of the data.
-
Custom territories: instead of being limited to rigid geographical zones, teams can set up custom ones.
-
Workbook formatting: Customize workbooks according to how a team wants them. Workbooks can be styled with options like customized fonts, which can be applied across the entire workbook.
A screenshot of Tableau's data highlighter. Photo via Tableau.
Integrations
Tableau’s mentality is to let users take advantage of BI with the app no matter where the data lies.
Tableau allows users to work with data from other applications and integrate some of the functionality from these apps:
-
Microsoft Excel
-
Actian Matrix
-
Box
-
Apache Drill
-
Google Analytics
-
IBM DB2
-
MarkLogic
-
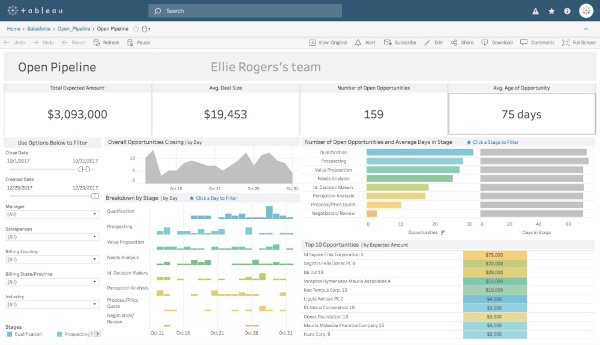
Salesforce
-
Teradata
-
Vertica
-
Python
-
MATLAB
A screenshot of a Salesforce pipeline template in Tableau. Photo via Tableau.
Benefits
Tableau’s feature set offers a number of benefits:
-
Ability to handle large data sets: This becomes more important as companies collect more data. Can handle large data sets without impacting dashboard performance.
SpareBank, for instance, was able to benefit from this and save millions of dollars over three years. This was largely due to the ability of Tableau to take large data sets and have them processed in a matter of minutes as opposed to days or weeks. This ensured they were acting proactively instead of reactively to market trends.
-
Use of other scripting languages: Languages such as Python can be used to run scripts that can automate and speed up tasks.
-
Mobile support frees teams up: Mobile support allows teams to function in a flexible way. This functionality allows them to access BI on their mobile devices even if they are out of the office and working in the field.
-
Responsive dashboards: Regardless of the size of a user's device display, dashboards will be re-sized to suit the display in the best way possible.
Use cases
Tableau can be used by a variety of industries and organizations:
Banking and finance
Companies involved in banking and finance can use BI solutions like Tableau to help them to operate as efficiently as possible. This can be challenging when working with large data sets. However, National Financial Partners demonstrated how effective Tableau is at letting organizations drill down into large data sets. They were able to use Tableau to generate data that helped them to figure out how to help insurance carriers that were part of their organization operate more efficiently. National Financial Partners noted that they were able to analyze data 10 times more quickly than if they had used traditional tools.
Health care
Tying data analysis results together in a cohesive way can be a challenge for traditional reporting solutions. This can be an issue for health care organizations who need to share information with medical personnel, so they can react to necessary changes that could positively impact patient care. Swedish Financial needed a more efficient way of generating reports and finding ways to improve performance. They spent millions of dollars on analysts generating reports prior to starting to use Tableau. After implementing Tableau, it was much easier to show staff where they needed to improve.
Education
Getting a grasp on student data can be tough. This is because there are many different categories to consider, like age, gender and grades. However, this information needs to be accessed in order for administrators to make strategic decisions. DePauw University needed to get a handle on their student data to help them with their strategic planning. Before implementing Tableau, the report generation process took weeks to put together. However, after Tableau, generating reports took about half of a day. This allowed advisors to be more agile with their planning.
User reviews
Tableau users often state they value its overall power as a BI solution.
However, many have noted that there is a bit of a learning curve with the application.
TrustRadius average rating: 8.3/10
G2 average rating: 4.5/5
Capterra average rating: 4.5/5
Pricing
-
For individuals: This plan costs $70/month. It includes either Tableau Desktop, Tableau Server or Tableau Online.
-
For teams and organizations: There are three different options for teams and organizations. There is a package that includes Tableau Viewer that’s priced at $12/user/month if it is deployed with Tableau Server (hosted on premises or public cloud). If it is deployed with Tableau Online (fully hosted by Tableau), then it is priced at $15/user/month. There is also a package that includes Tableau Explorer. It is billed at $35/user/month if deployed with Tableau Server. It is priced at $42/user/month if deployed with Tableau Online. Tableau creator goes for $70/user/month regardless of how it’s deployed. Every deployment requires one creator.
-
Embedded analytics: The embedded analytics package allows organizations to include Tableau analyses and dashboards in their own applications, products and web portals. Teams will have to contact Tableau to get details about this option.
BI market
The BI market projected to grow from $23.1 billion in 2020 to $33.3 billion in 2025, according to MarketsandMarkets.
Factors such as digital transformation and an increase in the amount of data being generated by businesses are spurring this growth.
BI software makers
These are some of the other top providers of business intelligence software:
-
Oracle
-
Microsoft
-
Zoho
-
Alteryx
-
Element Data
- Dundas


