B2B Marketing Statistics – By Budget, Teams, Trends, Buyer’s Journey, Industries, Strategies, SEO

Page Contents
- Introduction
- Editor’s choice
- Facts on B2B Marketing Statistics
- General Statistics
- Statistics by B2B Marketing Budget
- Statistics by B2B Marketing Teams
- Statistics by B2B Marketing Trends
- B2B Marketing Statistics by Channels Producing Leads
- Statistics by B2B Buyer’s Journey
- Statistics by B2B SEO
- Statistics by B2B Paid Marketing
- B2B Marketing Statistics by Strategies
- Statistics by B2B Social Marketing
- Statistics by B2B Video Marketing
- Statistics by B2B Email Marketing
- B2B Marketing Statistics by Industries
- Statistics by Content Marketing for B2B Marketers
- Future of B2B statistics
- Conclusion
Introduction
B2B Marketing is termed a business-to-business marketing process that refers to the marketing of products and services to other organizations and businesses. As of reports in 2023 over the world, 74% of B2B Marketers have set goals but out of which only 3% have achieved their marketing goals. The B2B Market is divided into 4 categories such as producers, resellers, government, and institutions. This is a vast field that includes several strategies, tactics, and tools that help businesses enhance sales by generating effective leads.
These B2B Marketing Statistics include insights from various aspects that provide light on why B2B Marketing is the latest trend of business in our modern society.
Editor’s choice
- According to Statista 2022, in-house marketing activities were conducted by 41% of B2B businesses.
- In North America, at least 1 content marketing activity was outsourced from half of the B2B marketing teams.
- By the end of 2030, it is expected that the B2B e-commerce market will reach $33,317.37 billion across the world.
- As of 2023, the American B2B digital ad spending is expected to be $15 million.
- B2B buying decision was made by 73% of millennial in 2022.
- Whereas, to drive the sales rate higher 86% of B2B marketers have used LinkedIn.
- In 2022, around the world, 66% of B2B marketers have planned to increase their spending on B2B content marketing.
- In the United States, the marketing efforts of B2B product marketers made up 7.78% of the company’s revenue in September 2022.
- After reading the content, almost 52% of buyers are more inclined to purchase from vendors in 2023.
- The major area of marketing spending comes from website development which is leading with 51%, followed by digital marketing (44%), content marketing (33%), Branding (27%), and social media (22%).
Facts on B2B Marketing Statistics
 (Source: startupbonsai.com)
- In 2023 around the world, B2B buyers by 77% have faced an overly complex last deal in a B2B buying cycle.
- As of now, the B2B buying cycle is getting shorter According to the latest B2B marketing stats only 33% of B2B marketers have completed sales within four to six weeks.
- In 2022, near about 82% of online traffic came from video content.
- For enhancing sales rate 41% of marketers are currently using the B2B video marketing strategy.
- The significant purchase factor for buyers is content personalization and 63% of B2B teams include approximately 3 decision makers.
- By the end of 2022, the market size of the B2B e-commerce market will have grown by $7907.04 billion.
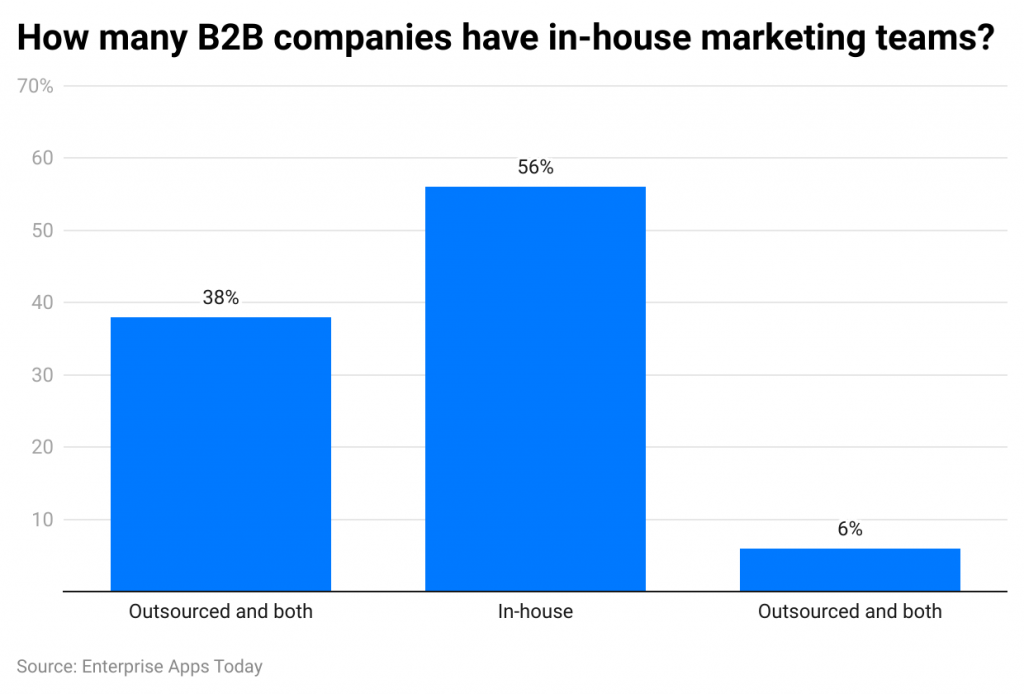
- According to Statista 2022, in the United States in-house marketing teams were observed in 56% of B2B companies, 38% of B2B companies had both outsourcing and in-house marketing, and 6% of companies' marketing tasks were outsourced.
- The most implemented B2B tactic in 2022 was email marketing with a leading share of 84%, second best B2B tactic was social media used by 75% of B2B experts followed by content marketing and blogging (69%).
- According to Statistics, in the U.S. formal B2B marketing plan was used by 70% of B2B companies.
General Statistics
- In July 2022, worldwide B2B Marketers stated that 50% of B2B Marketers have planned to increase their marketing spending by the end of July 2023 whereas, 14% of B2B Marketers have planned to increase their spending by 9% and marketing spending was slowed down by 4% of B2B Marketers.
- It has been observed that the spending on digital advertising has increased in 2022 resulting in $239.89 billion and it is expected to be $270.73 billion (2023) followed by $293.34 billion (2024), and $315.32 billion (2025).
- 32% of U.S. companies spend on B2B marketing which dedicates 5% of their budget to marketing.
- Whereas, 23% of B2B companies didn’t put any effort into implementing B2B strategies and spent less than 1%.
- Only 47% understand the importance of B2B strategies which allocate almost 10% to the marketing sector.
- On the other hand, across the world, only 13% of companies have reported spending on total budget with more than 15%.
Statistics by B2B Marketing Budget
 (Source: startupbonsai.com)
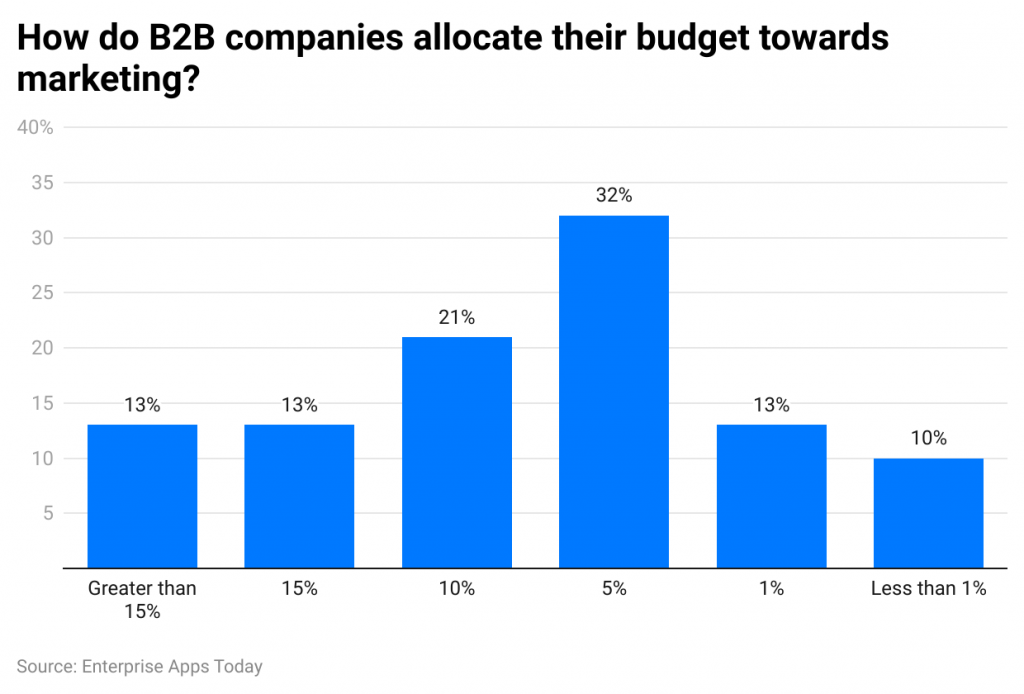
- As of 2022, around 32% of B2B companies have invested almost 5% of their annual budget for marketing.
- 21% of B2B companies have allocated 10% of their budget followed by more than 13% of B2B companies that have invested 15% of their budget, another 13% of B2B companies have allocated only 1% of their budget and 10% of B2B companies have allocated less than 1% budget for enhancing marketing.
Statistics by B2B Marketing Teams
- In North America in 2022, at least 1 content marketing activity was outsourced from half of the B2B marketing teams.
- 84% of marketing teams outsourced cite content creation activities.
- Whereas, the other activities that B2B marketing teams outsource are followed by content distribution (31%), content technology (22%), Content strategy (13%), Measurement (13%), Editorial planning (12%), and others (18%).
Statistics by B2B Marketing Trends
- As of 2023, in the United States, almost 23.6% of businesses are spending in the B2B market.
- Currently, online sales have increased in the B2B worldwide organizations.
- In 2022, customers of the B2B market were more dependent on the Internet or web content than salespeople.
- It is expected that the United States is going to spend more than $30 billion on advertising by the end of 2023 projecting a share of 48%.
- Whereas, the spending on B2B digital ad spending is expected to be $15 billion in the U.S. resulting in a growth of 15.1%.
B2B Marketing Statistics by Channels Producing Leads
 (Source: 99firms.com)
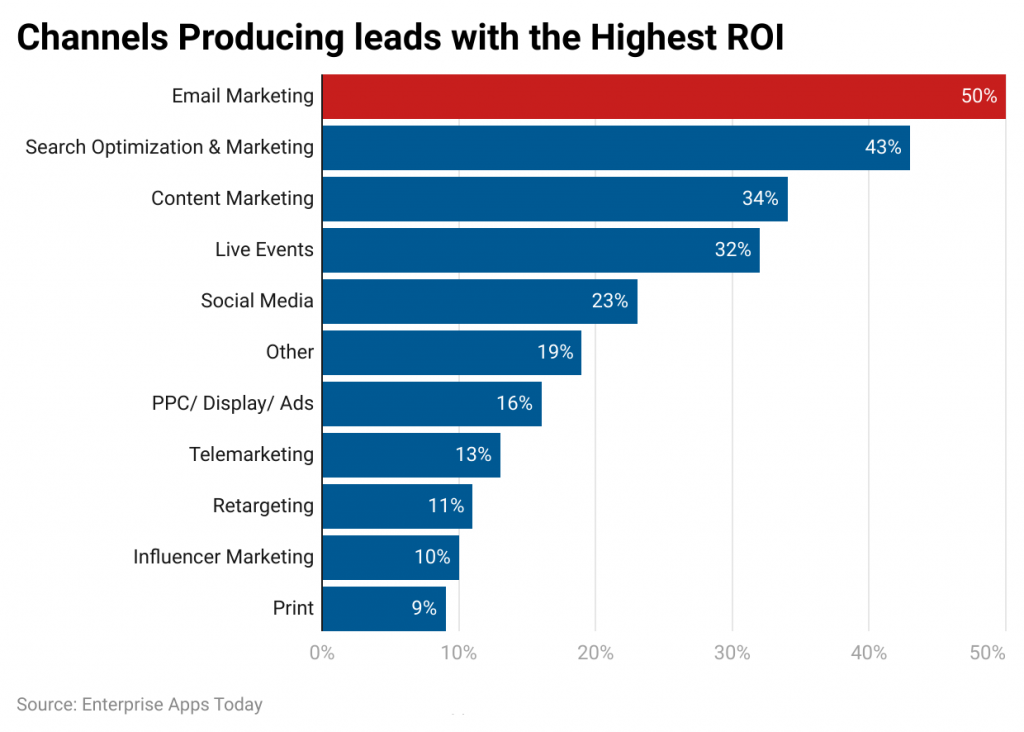
- In 2022, B2B marketers have stated that the best channel for generating leads with the highest return on investment (ROI) is 50% email marketing.
- The other channels used by B2B marketers are search optimization and marketing (43%), content marketing (34%), live events (32%), Social media (23%), and other (19%)
- The least used channels are followed by 16% PPC/Display ads, 13% telemarketing, 11% retargeting, 10% influencer marketing, and 9% print.
Statistics by B2B Buyer’s Journey
 (Source: startupbonsai.com)
- As of 2022, in B2B businesses more than 60% of buyers were likely to make repeat purchases whereas, 62% of business buyers have preferred cooperating with old vendors.
- Video content played an effective role as over 70% of business buyers have watched videos for product research. The most effective video content is creative ads, studies, testimonials, case studies, etc.
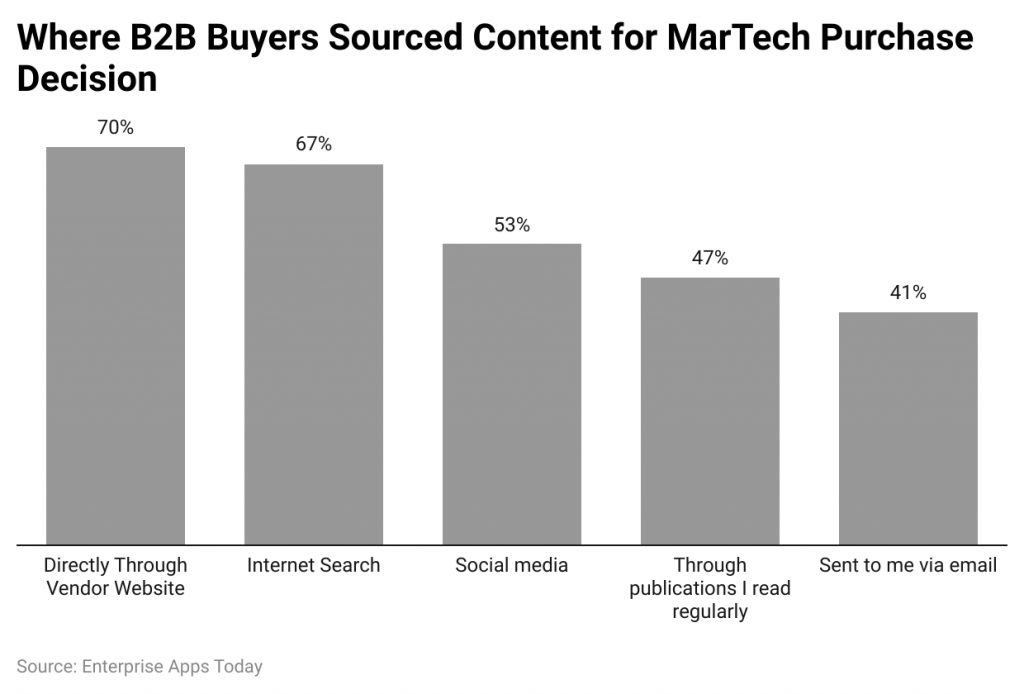
- B2B buyer’s purchasing decision was influenced directly by vendor website (70%), internet search (67%), Social media (53%), regular publication (47%), and email content (41%).
- Before making a purchasing decision in 2022, average B2B business buyers go through 10-13 pieces of content.
- Remote or digital interaction was preferred by 70% of B2B buyers and human or self-service interaction was preferred by 80% of B2B buyers.
- According to B2B digital marketing statistics, 70%-74% of B2B business buyers have spent half of their time doing online research on websites, video sites, social media, and search engine results in 2022.
Statistics by B2B SEO
- In 2023, the most effective type of content used by B2B businesses is leadership content.
- 95% of traffic is received by search engine results page.
- According to search engine optimization statistics, B2B marketers achieved 70% of organic traffic from searches.
- In 2022, almost 40% of the B2B Company’s revenue has increased by using organic search in content marketing.
- For finding out online information 71% of B2B clients preferred using search engines.
- Before making offline payments, three-quarters of B2B clients used to explore the internet.
Statistics by B2B Paid Marketing
- As of 2023, almost 16% of B2B companies claimed that the top spending of digital marketing is online advertising.
- For enhancing brand awareness and driving out paid traffic 6% of B2B firms have used YouTube.
- In B2B industries the average cost per click is around $3.33 and in the B2B niche, the average cost per 1k ad impressions is $0.79.
- For launching advertising campaigns almost 80% of B2B marketers used Google Ads.
- In the case of sharing online content around 61% of B2B marketers used paid ads.
B2B Marketing Statistics by Strategies
- The other effective strategies are followed by personalization (32%), Inbound Marketing (29%), Podcast and live streaming (27%), conversational marketing with chatbots (24%), and mobile-first strategy (22%).
- Some least used strategies are programming advertising, voice optimization, CMR, digital marketing, and SMM with shares holding 11%, 11%, and 5% respectively.
Statistics by B2B Social Marketing
(Source: kurve.co.uk)
- The five highest-performing strategies used by B2B markets in 2022 are account-based marketing (46%), video marketing (41%), influencer marketing (38%), artificial intelligence (38%), and retargeting (33%).
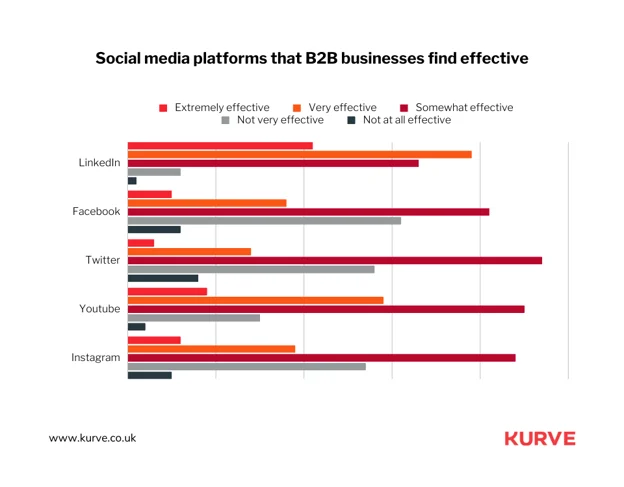
- Among B2B marketers across the world, the most popular social media platform is Facebook and 42% of B2B organizations have used social media to attract new clients.
- Across the world, B2B marketing specialist by 83% has shared their content on this platform, and Facebook ad campaigns were launched by 2/3rd of marketers.
- For content production, 95% of B2B companies have dedicated a budget.
- One-third of internet users’ time was spent online exploring social media.
- The main source of using social marketing is to increase brand awareness by 25% of marketing firms.
- Another way of increasing brand awareness in 84% of B2B businesses is influencer marketing.
- Out of four one B2B marketers have used Pinterest for promoting their online business and this is termed as one of the popular social media platforms.
- The second most popular social media platform is LinkedIn and almost 89% of businesses use it for generating leads and 65% of B2B business firms attract new clients by using this platform.
- Twitter is the 3rd largest social media platform and as of the 2022 survey report 1 out of 3 B2B firms have used Twitter ads for content marketing.
- According to marketing statistics, Instagram was used by 46% of B2B content marketing specialists.
- For enhancing potential client reach 17% of organizations used Instagram ads.
Statistics by B2B Video Marketing
- As of 2023, video marketing spends 88% more time on their sites and helps in drawing user’s attention.
- More leads are attracted by video content along with increasing conversion rates which is claimed by 83% of B2B markets.
- Over the world, video marketing is used by 75% of companies to help increase ROIs.
- The most effective client conversion is experienced by 71% of video marketers.
- Unique videos are created by 71% of video marketers.
- 53% of companies use the YouTube platform for sharing online videos.
Statistics by B2B Email Marketing
- As of 2023, a B2B user spends around 35 minutes exploring their email inboxes per week.
- According to B2B marketing statistics, 31% of marketers believed that email engages more readers.
- Email messages are used as tools by 82% of marketing specialists for sharing informative content with others.
- By the end of 2022, on average 1 out of 5 B2B emails was opened.
- For increasing sales opportunities, 81% of B2B content marketers have used newsletters to keep their subscribers informed.
- Around 16% of B2B companies or organizations will spend more on email marketing in 2023 across the world.
- B2B email's average click-through rate is around 5%.
- Whereas, email marketing is termed as the top tool used by 59% of B2B organizations that helped in gaining sales.
B2B Marketing Statistics by Industries
- Almost 50% of the High-tech B2B industry remained digital and in coming years the trends are expected to enhance more.
- Whereas, the high–tech industry remained extremely competitive in 2022 stated by 60% of organizations.
- Meetings with sales managers were avoided by 59% of B2B tech buyers
- The average cost for generating leads in the B2B financial sector is around $43 and for overcoming competitors in financial service sectors 77% of financial institutions have planned on implementing innovation.
- According to B2B marketing strategies, the largest B2B financial company is Stripe
- As of 2022, 26% of the budget was spent by B2B companies in manufacturing industries on marketing.
- B2B businesses in the worldwide healthcare industry have invested 18% of their budgets in marketing efforts.
- In the sectors of insurance, finance, and banking B2B companies have spent around 14% of their budget on marketing strategies.
- B2B businesses of software industries have spent around 1/3rd of their budget on marketing departments.
- Whereas, only 2% of the budget was used on marketing by mining and construction-based B2B organizations.
Statistics by Content Marketing for B2B Marketers
 (Source: kurve.co.uk)
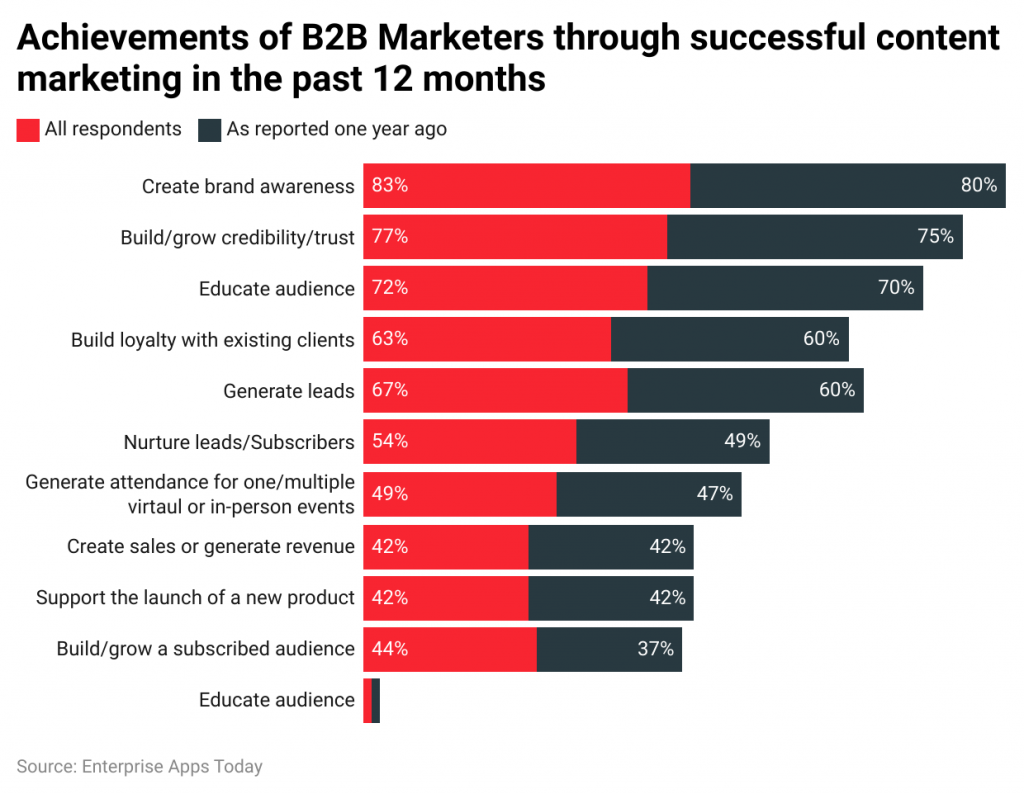
- As of 2023, B2B marketers have achieved successful content marketing by creating 83% brand awareness, and in 2022 it was around 80%.
- The other successful content marketing in 2023 and 2022 are followed by building/trust/growing credibility (77% and 75%), educating the audience (72% and 70%), Building loyalty with existing clients (63% and 60%), Generate leads (67% and 60%), and Nurture leads/subscriber (54% and 49%).
- Whereas, other achieved goals of content marketing in 2023 and 2022 are generating leads for one/multiple virtual or in-person events (49% and 47%), creating sales or generating revenue (42% and 42%), supporting the launch of a new product (42% and 42%), build/grow a subscribed audience (44% and 37%), and educate audience (2% and 2%).
Future of B2B statistics
 (Source: thrivemyway.com)
Conclusion
As of now after completing the article on B2B Marketing Statistics it can be easily stated that the B2B niche has remained very competitive and marketers across the world have used several marketing strategies and tactics to achieve their business goals. It has been observed that B2B businesses those are having good content marketing strategies remain more beneficial for attracting new clients and worldwide 91% of marketers have used B2B marketing strategies in their businesses. Fortunately, the article includes effective statistics that will shed light on how the market works
Sources
FAQ.
These allow in identifying more sales opportunities, also coverts more leads in effective customers, creating better end-to-end customer experience, increased lifetime value of customers, helps in making marketing more accountable and makes business marketing more scalable.
Brands having best B2B marketing trends are New Relic, Google, Salesforce, Spourt, Invision, Workday, GE, Cisco, Hubstop, Intel, Fullscreen, Skype, Kickstarter, IBM, and Qualcomm.
Outfunnel, ActiveCampaign, io, Constant Contact, and Litmus
Leadfeeder, Act-On, LeadSquared, Leadpages, SharpSpring, Sumo, and Autopilo
Moz, Ahrefs, BuzzSumo, Yoast, Clearscope, SEMrush, and Google Search Console

Barry is a lover of everything technology. Figuring out how the software works and creating content to shed more light on the value it offers users is his favorite pastime. When not evaluating apps or programs, he's busy trying out new healthy recipes, doing yoga, meditating, or taking nature walks with his little one.
