Instacart Statistics 2023 By Demographics, Brand Awareness, Device Traffic, Revenue, Preferred Platform and Traffic Sources
Page Contents
- Introduction
- Editor’s Choice
- What is Instacart?
- General Instacart Statistics
- Instacart Statistics by Demographics
- Instacart Statistics by Brand Awareness
- Instacart Statistics by Device Traffic
- Leading online Grocery Delivery Apps by Brand Awareness in the USA
- Average Spend Per Order on Selected Services in the USA
- Most Downloaded Grocery Delivery Apps in the USA
- Instacart Statistics by Revenue 2019 to 2024
- Funds Raised by Online Food Delivery Apps Around the World in 2023
- Most Preferred Platforms for Beauty Purchases in the USA in 2023
- Online Grocery and Beverage Shopping by Preferred Platform
- Instacart Statistics by Traffic Sources on the Website
- Conclusion
Introduction
Instacart Statistics: Day by day we are getting comfortable in our houses and prefer everything to get delivered to our doorsteps. The concept of everything under one roof has been changed to digital stores where everything you want can be purchased in just one click. Platforms such as Instacart, Uber Eats, Amazon Fresh or Amazon Pantry, and Walmart are a few of the many other best online food delivery apps. These Instacart Statistics are already telling us the future of the online food and grocery delivery industry, and this is just one platform performing so well in the USA.
Editor’s Choice
- In 2022, as stated by Instacart Statistics, the platform topped the list for generating the most downloads in the delivery apps category resulting in 8.69 million
- By 2024, Instacart Statistics predicted that the total grocery sales on the platform in the United States of America would reach 40.5 billion.
- The majority of the shoppers are female resulting in 55.5%, while the remaining are male consumers (44.5%).
- In 2023, Instacart partnered with more than 1200 retail businesses along with 80,000 stores in North America.
- On the Instacart platform, 9 orders are processed every 1 second, which becomes 533 orders per minute, thus generating 21,476,000 orders per month and 257,712,000 a year.
- Instacart platform has the majority of the consumers aged between 25 to 34% resulting in 26.7%.
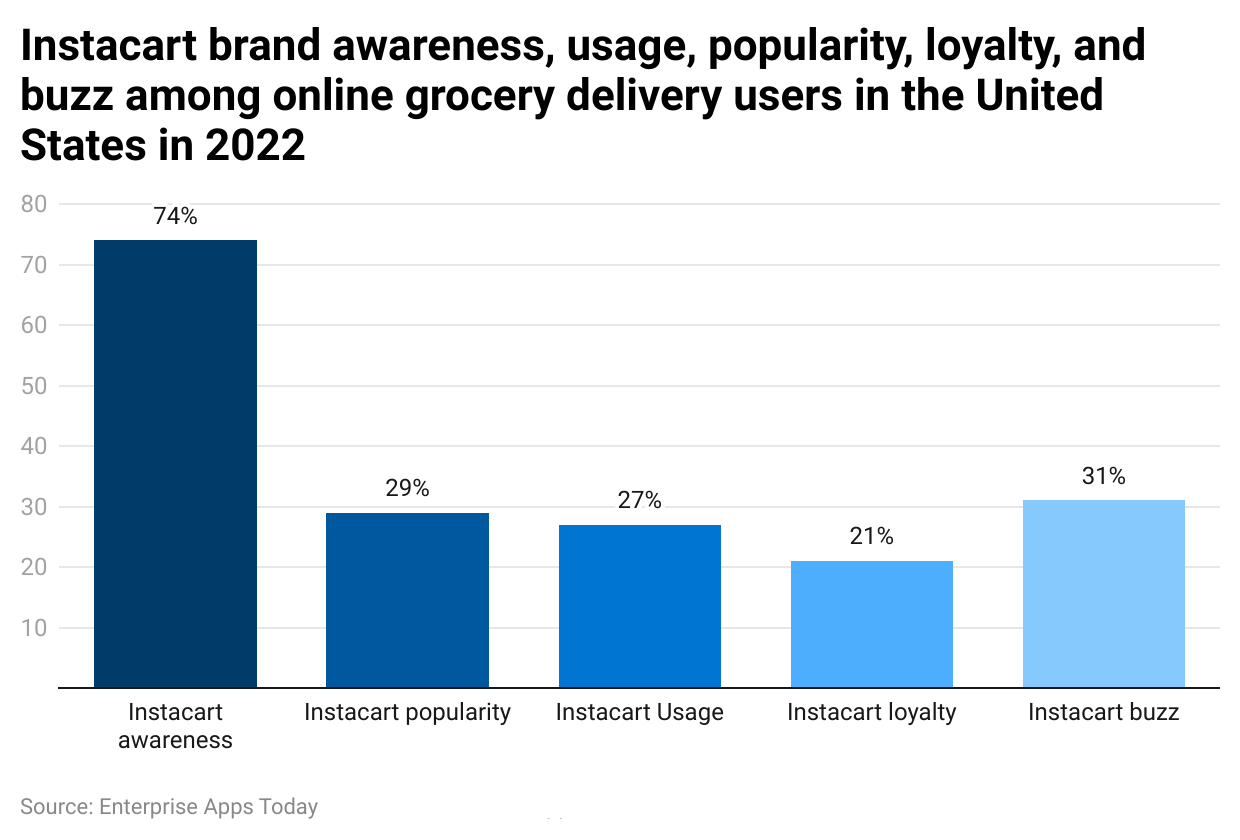
- As of 2022, 74% of Americans knew about the Instacart platform. The popularity of the same was however only 29%.
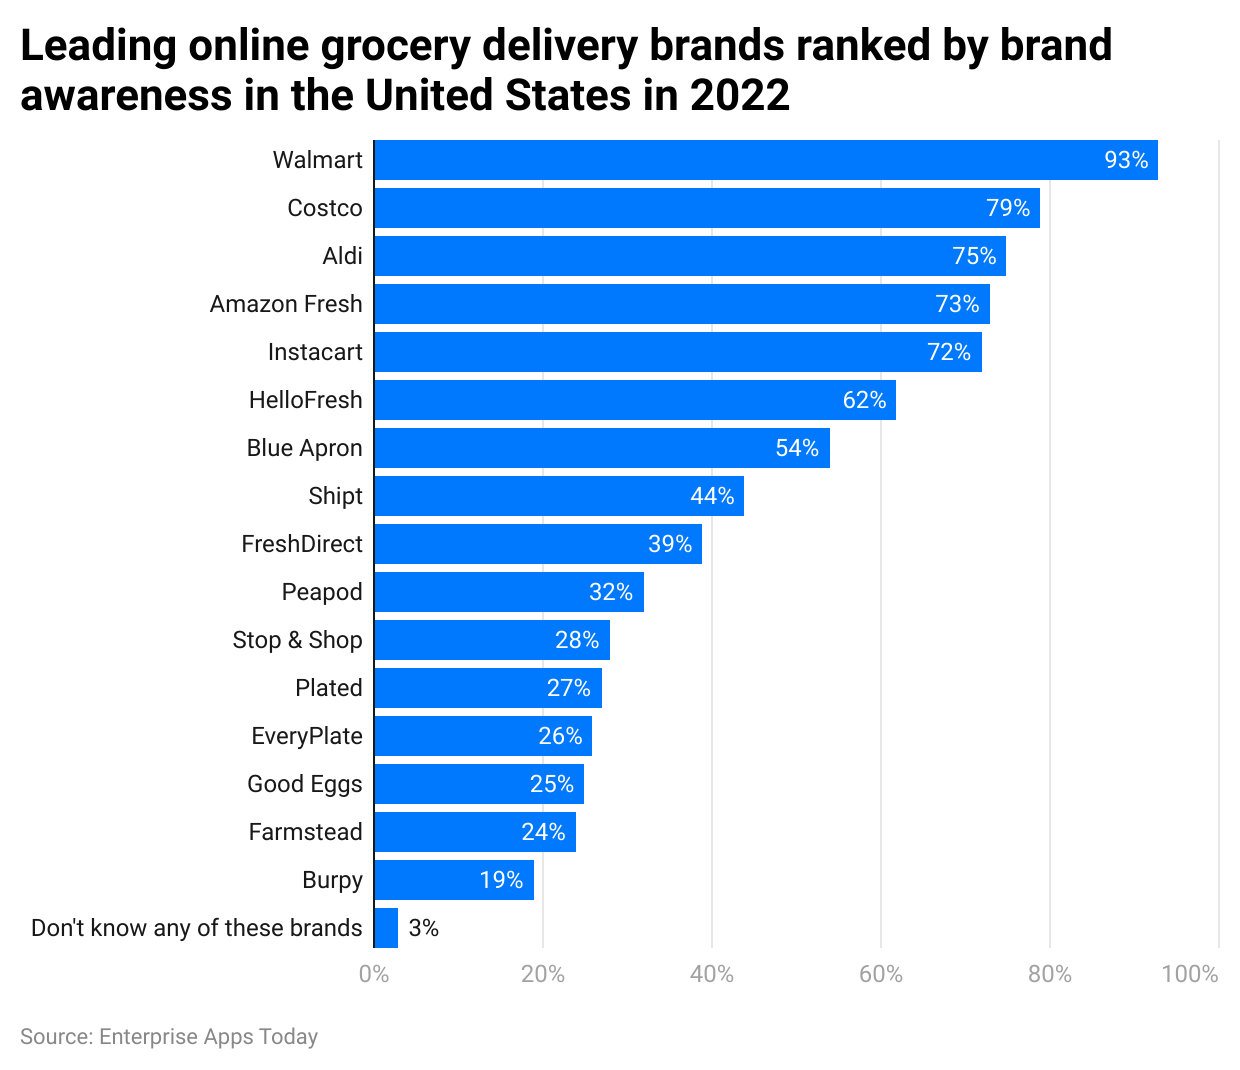
- In 2022, in the United States of America, Instacart ranked among the top 5 leading online grocery apps by brand awareness with a 72% rating.
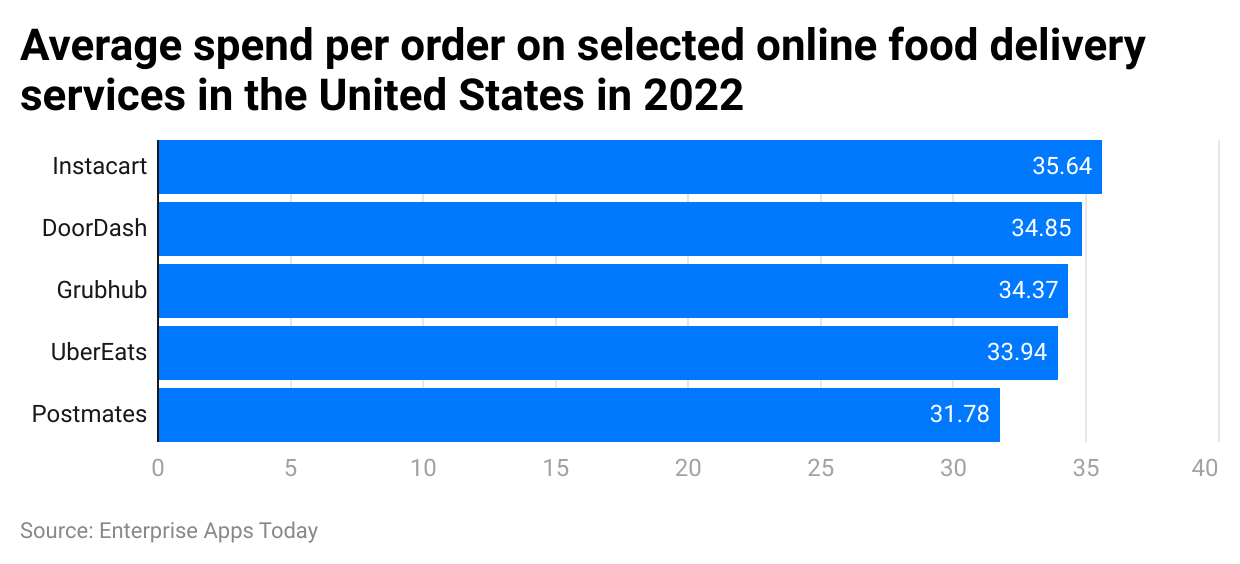
- Instacart Statistics showed that on average a user spent around $35.64 on the Instacart platform. However, on other platforms, users spent as follows DoorDash ($34.85), Grubhub ($34.37), UberEats ($33.94), Postmastes ($31.78).
- In 2022, the majority of the consumers contributed from the United States of America resulting in 99.2%, whereas 0.81% were located in Canada.
What is Instacart?
Instacart is an American online food and grocery delivery app service. It is currently operating in the United States of America and Canada. Their headquarters are in San Francisco, California, USA. It was founded in 2012, by Apoorva Mehta, Max Mullen, and Brandon Leonardo. When Apoorva was 26 years old, he was out of groceries and found it difficult to go to shops and purchase without owning a car. Which led to the foundation of Instacart. Today, the platform delivers millions of food and grocery items to doorsteps. According to reports, during lockdown, the platform has helped many households to stock up with their groceries.
General Instacart Statistics
- By 2024, Instacart Statistics predicted that the total grocery sales on the platform in the United States of America would reach 40.5 billion.
- Furthermore, the InstaCart GMV (Gross Merchandise Value) is expected to touch $27 billion by 2025.
- 1 out of every 4 online buyers in the United States of America use Instacart.
- Consumers spend around 7 minutes and 23 seconds on the platform.
- In 2022, Instacart recorded a total number of 13.7 million daily active users.
- On the Instacart platform, 9 orders are processed every 1 second, which becomes 533 orders per minute, thus generating 21,476,000 orders per month and 257,712,000 a year.
- In 2023, Instacart partnered with more than 1200 retail businesses along with 80,000 stores in North America.
- In 2022, the majority of the consumers contributed from the United States of America resulting in 99.2%, whereas 0.81% were located in Canada.
- As of October 2023, the platform generated 28.09 million of global traffic, while it was 25.14 million and 20.34 million in September and August respectively.
- Compared to other grocery delivery apps, in 2024, the majority of the projected sales belong to Instacart resulting in 72.5%, followed by DoorDash (11.6%), and Uber (7.9%).
- As of 2022, the most ordered food item in the United States of America was Bananas.
- com has the following food categories available for doorstep delivery: Meat, Frozen Food, dairy, pantry, food, fresh produce, baked goods, seafood, alcohol, wine, liquor, beer, coffee, meat alternatives, beverages, tea, organic grocery, and water.
- This platform has more than half a million products partnered with more than 85,000 stores in the country.
- On average, the per-person revenue generated by Instacart is $29.
- As of today, this online food delivery platform has more than 600,000 customers.
- Instacart's research shows that 20 to 30% of consumers add items they have already bought before.
- Furthermore, 40 to 50% of consumers usually search for items they know they will need at home.
- On the other hand, 20 to 35% of consumers will add items from the browse and discover feature.
Instacart Statistics by Demographics
By Gender
(Reference: prioridata.com)
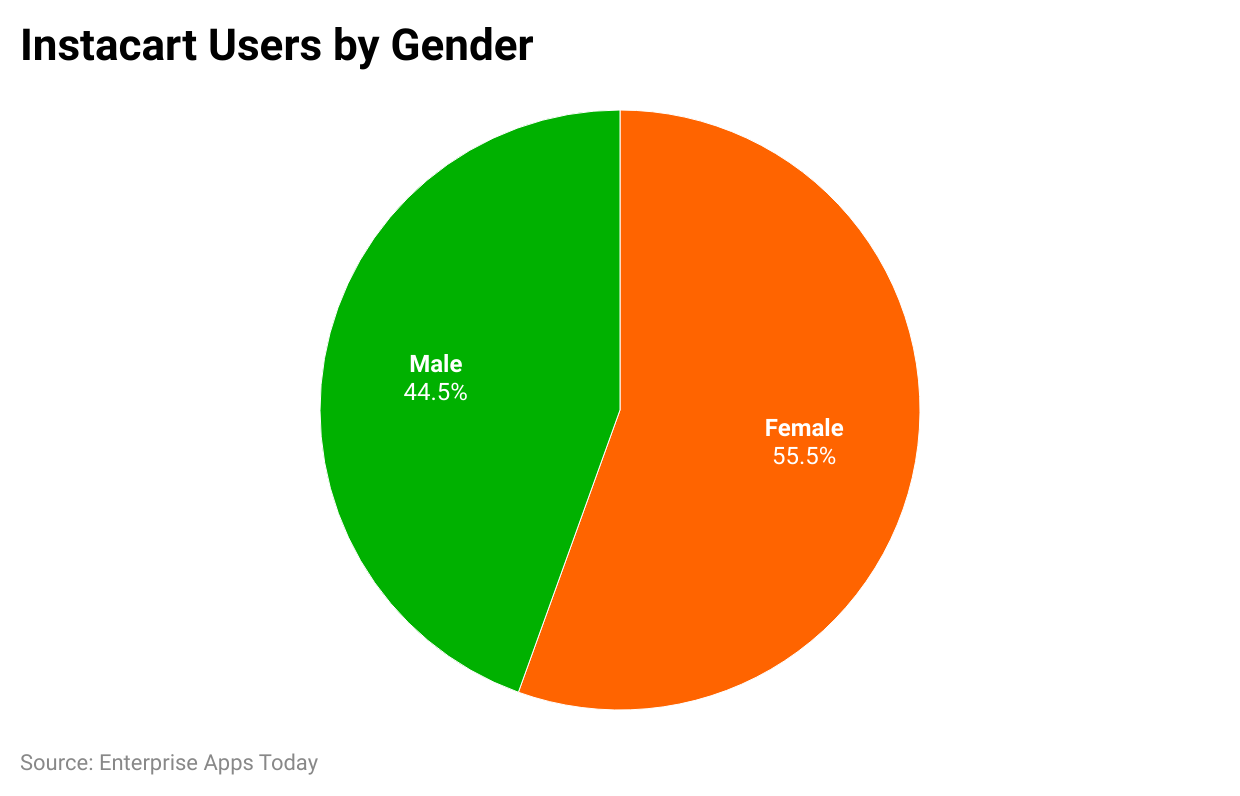
The majority of the shoppers are female resulting in 55.5%, while the remaining are male consumers (44.5%).
By Age
(Reference: prioridata.com)
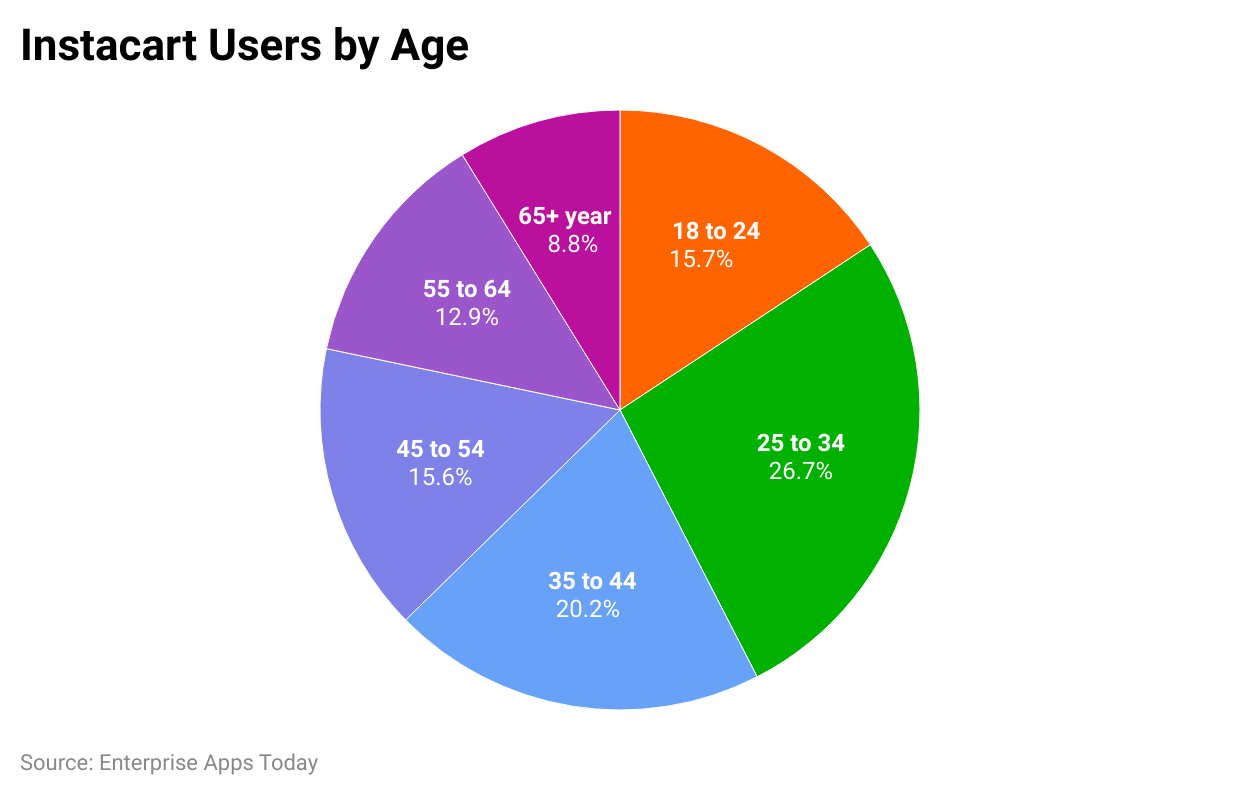
Instacart platform has the majority of the consumers aged between 25 to 34% resulting in 26.7%. Whereas other demographic age-wise profile states consumer data as 35 to 44 years (20.2%), 18 to 24 (15.7%), 45 to 54 (15.6%), 55 to 64 (12.9%), and 65 years and above (8.8%).
Instacart Statistics by Brand Awareness
(Reference: statista.com)
As of 2022, 74% of Americans knew about the Instacart platform. The popularity of the same was however only 29%. Whereas, the overall usage out of these Americans was 27%, while only 21% were loyal to the brand. Furthermore, 31% of the Americans were buzzing about the brand in 2022.
Instacart Statistics by Device Traffic
(Reference: semrush.com)
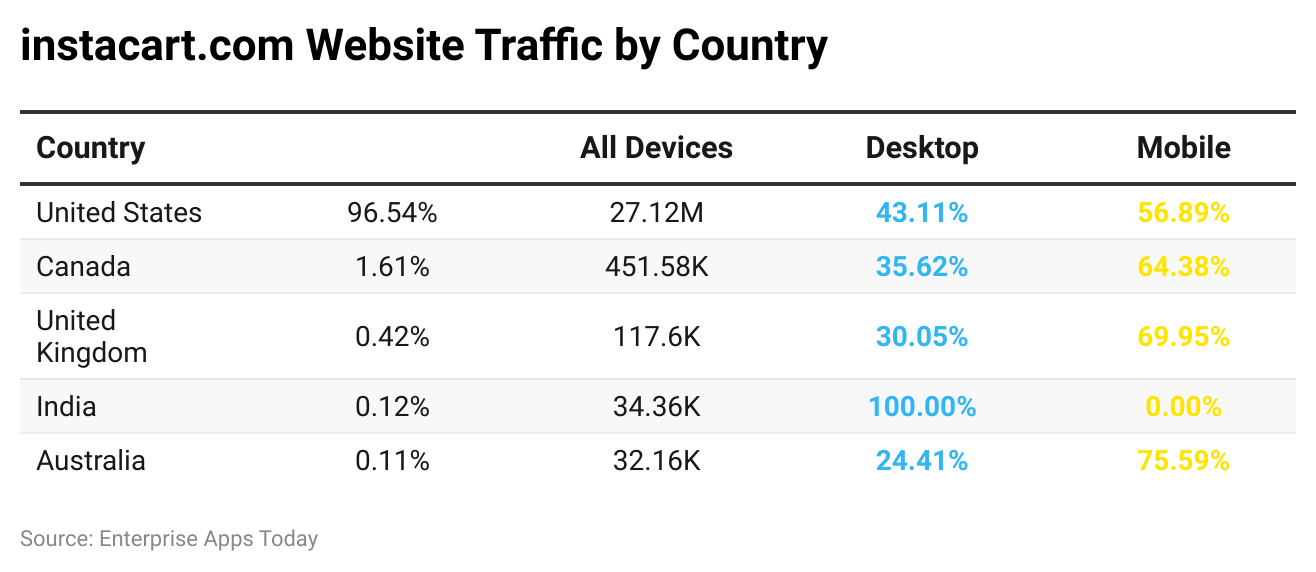
Looking at the above chart, Instacart Statistics show that the majority of consumers order from mobile devices in all of the above countries. However, a greater percentage of consumers is located in the United States of America resulting in 96.54% of traffic. Furthermore, over the last 6 months, mobile devices generated 56.94%, and desktop traffic contributed 43.06%. Overall 10 million desktop devices and 20 million mobile devices were found to create the overall traffic.
Leading online Grocery Delivery Apps by Brand Awareness in the USA
(Reference: statista.com)
In 2022, in the United States of America, Instacart ranked among the top 5 leading online grocery apps by brand awareness with a 72% rating. The top leading delivery app in the USA was Walmart (93%), followed by Costco (79%), Aldi (75%), and Amazon Fresh (73%). However, there were 3% of Americans were not aware of any of the brands mentioned above in the chart.
Average Spend Per Order on Selected Services in the USA
(Reference: statista.com)
Out of the above-mentioned online food delivery services, Instacart Statistics showed that on average a user spent around $35.64 on the Instacart platform. However, on other platforms, users spent as follows DoorDash ($34.85), Grubhub ($34.37), UberEats ($33.94), Postmastes ($31.78).
Most Downloaded Grocery Delivery Apps in the USA
(Reference: statista.com)
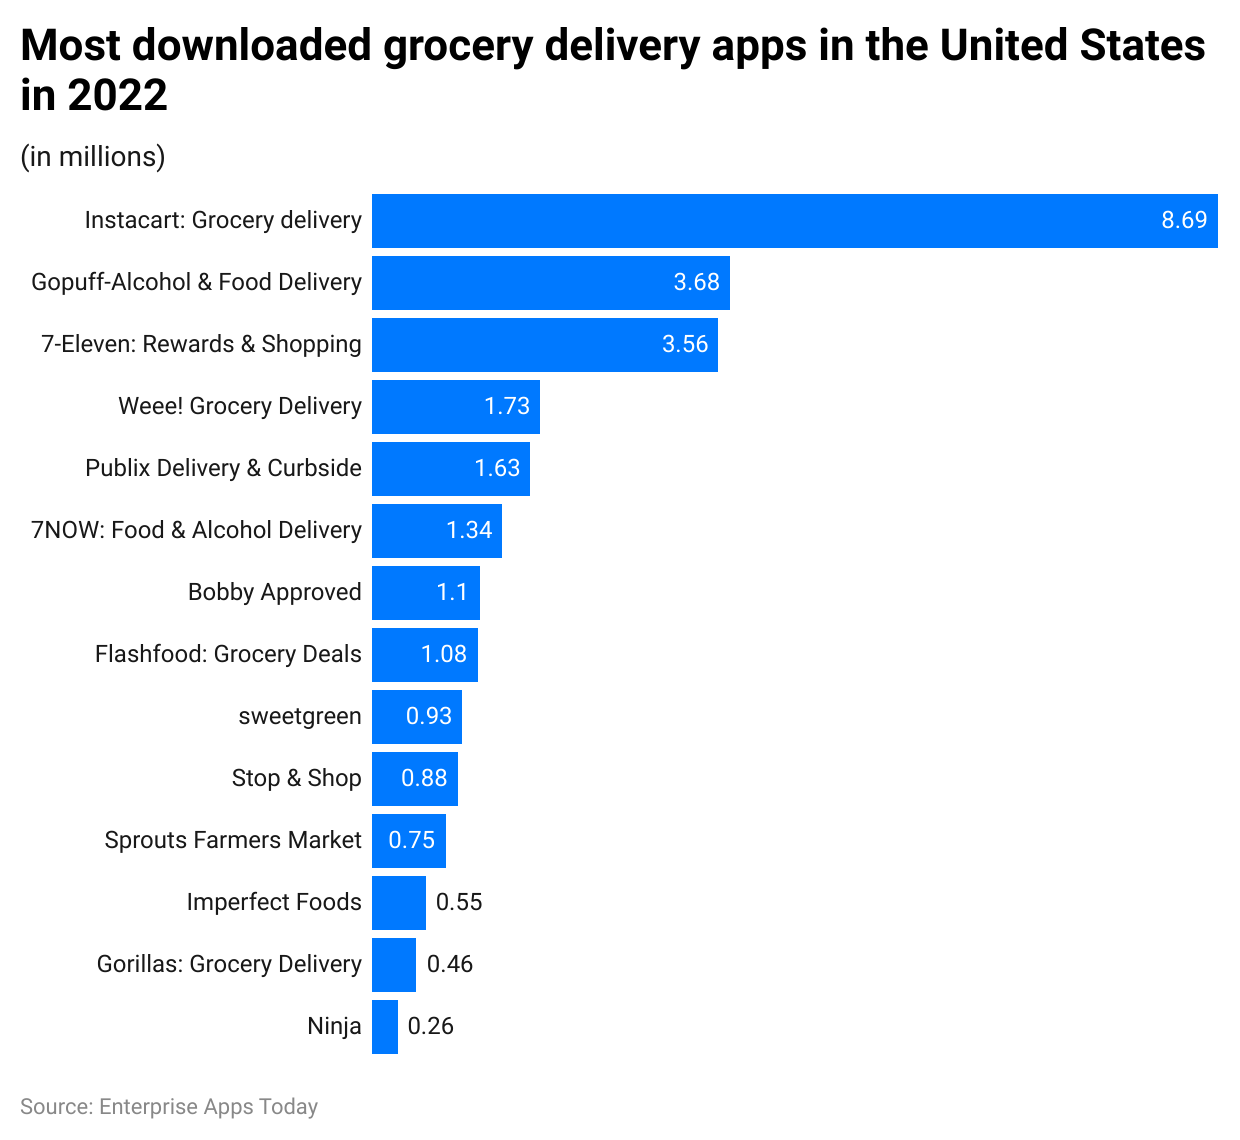
In 2022, as stated by Instacart Statistics, the platform topped the list for generating the most downloads in the delivery apps category resulting in 8.69 million. Other food delivery apps ranked in the top 5 were Gopuff – Alcohol & Food delivery (3.68 million), 7-Eleven: Rewards and Shopping (3.56 million), Wee – Grocery Delivery (1.73 million) and Publix Delivery & Curbside (1.63 million).
Instacart Statistics by Revenue 2019 to 2024
(Reference: statista.com)
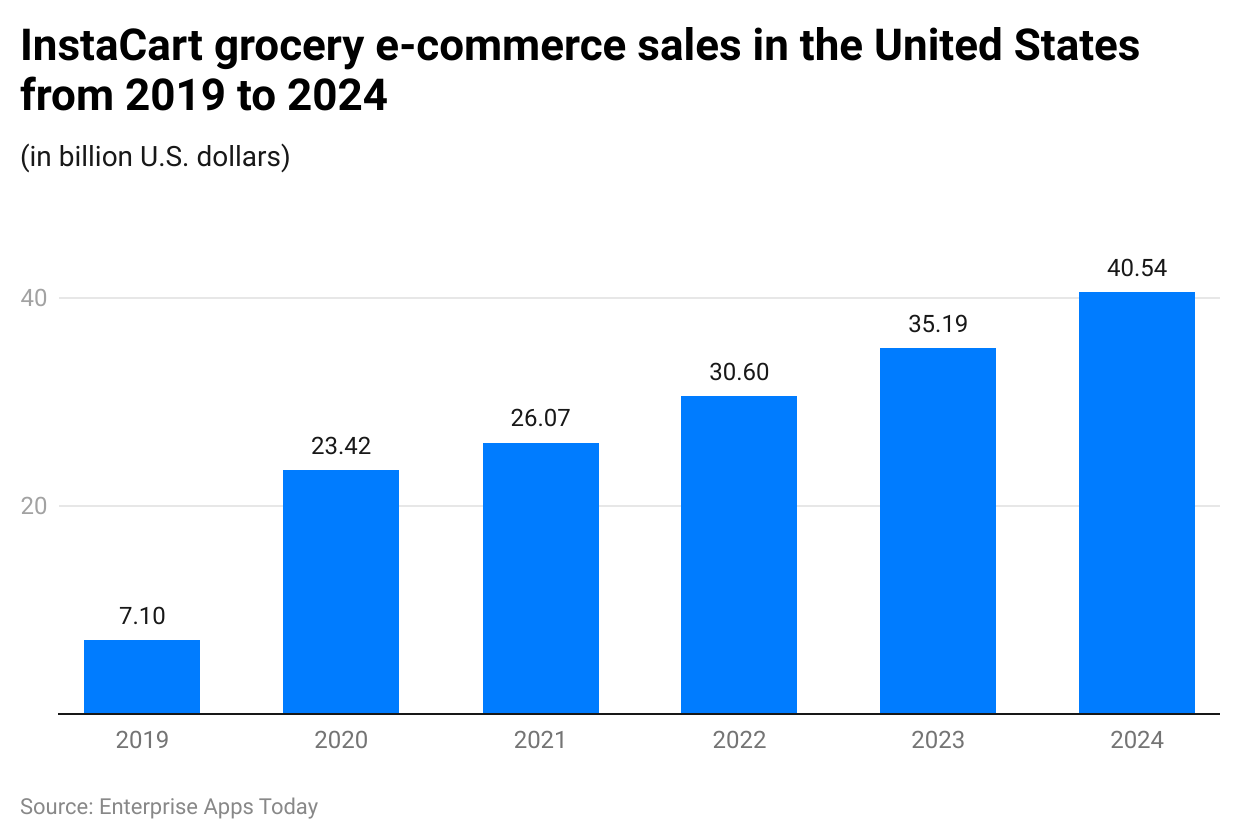
The special mentions of lockdown deliveries have majorly increased the amount of sales to $23.42 million from $.71 billion in just 1 year. With the rising revenue estimates, this online food delivery app is projected to make $40.54 billion in 2024.
Funds Raised by Online Food Delivery Apps Around the World in 2023
(Reference: statista.com)
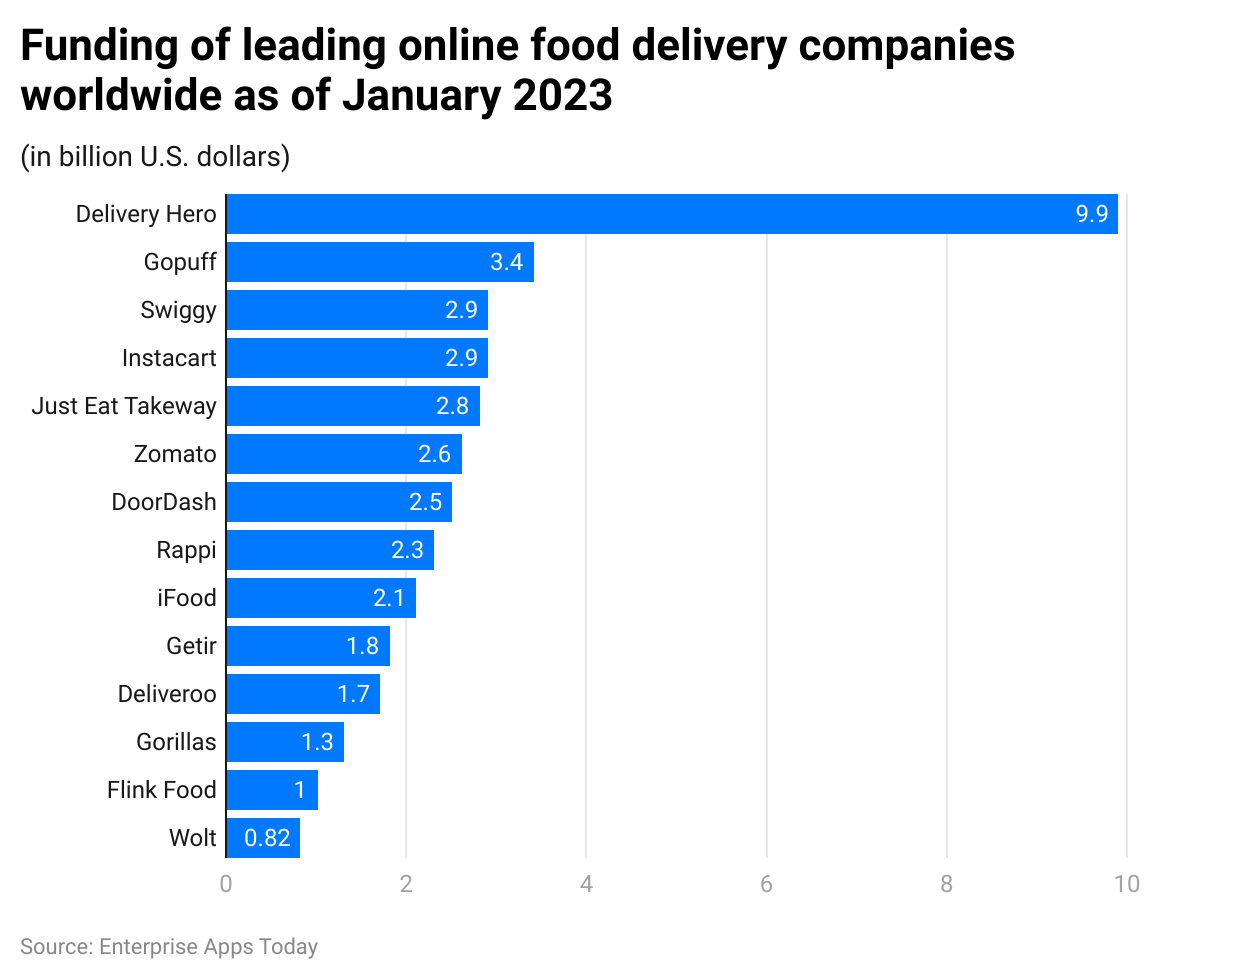
According to Instacart Statistics, Swiggy and Instacart similarly raised $2.9 billion funding 21 rounds of investment. However, Delivery Hero generated the most of all resulting in $9.9 billion followed by $GoPuff 3.4 billion.
Most Preferred Platforms for Beauty Purchases in the USA in 2023
(Reference: statista.com)
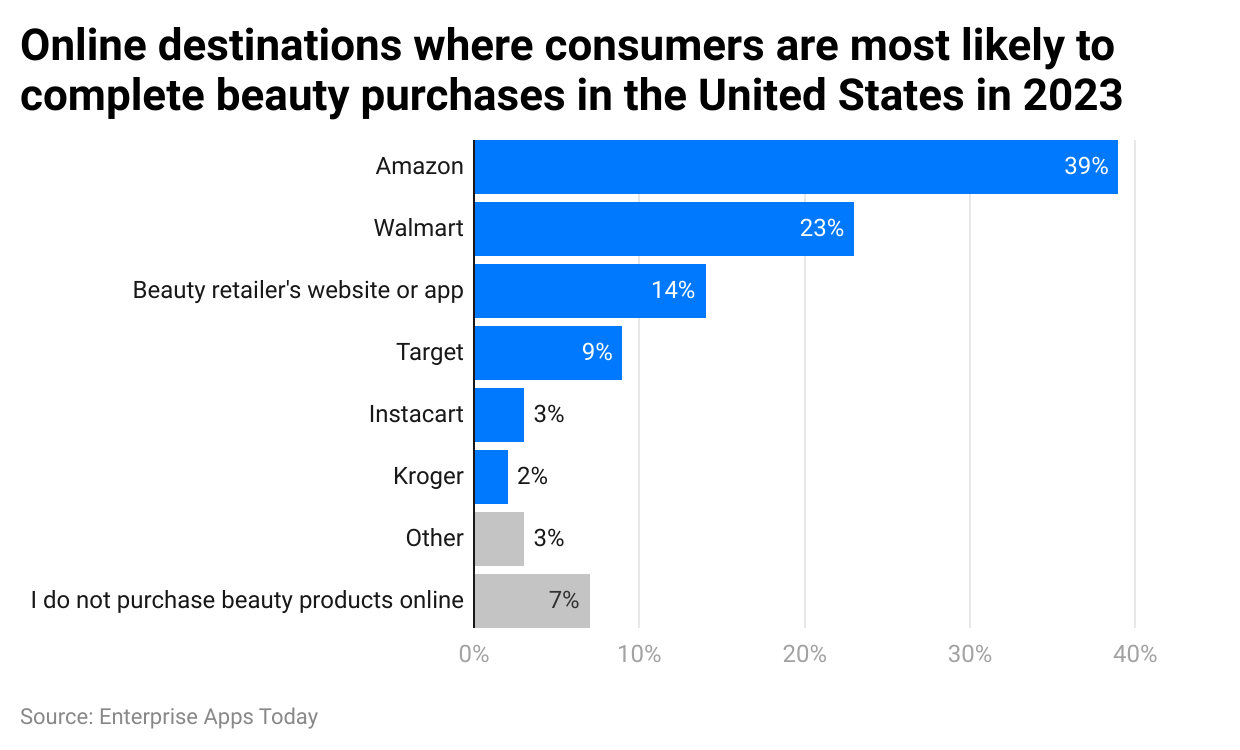
As of 2023, in the United States of America, the most preferred platform to make beauty purchases is Amazon voted by 39% of consumers. However, only 3% of consumers prefer to shop on Instacart.
Online Grocery and Beverage Shopping by Preferred Platform

(Reference: statista.com)
As of September 2023, the top 5 leading online grocery and beverage shopping platforms by Americans are Walmart (53%), Amazon Fresh/ Pantry (42%), Costco (25%), Aldi and Instacart (21%). There are 9% of consumers who shop from companies other than those mentioned above in the chart.
Instacart Statistics by Traffic Sources on the Website
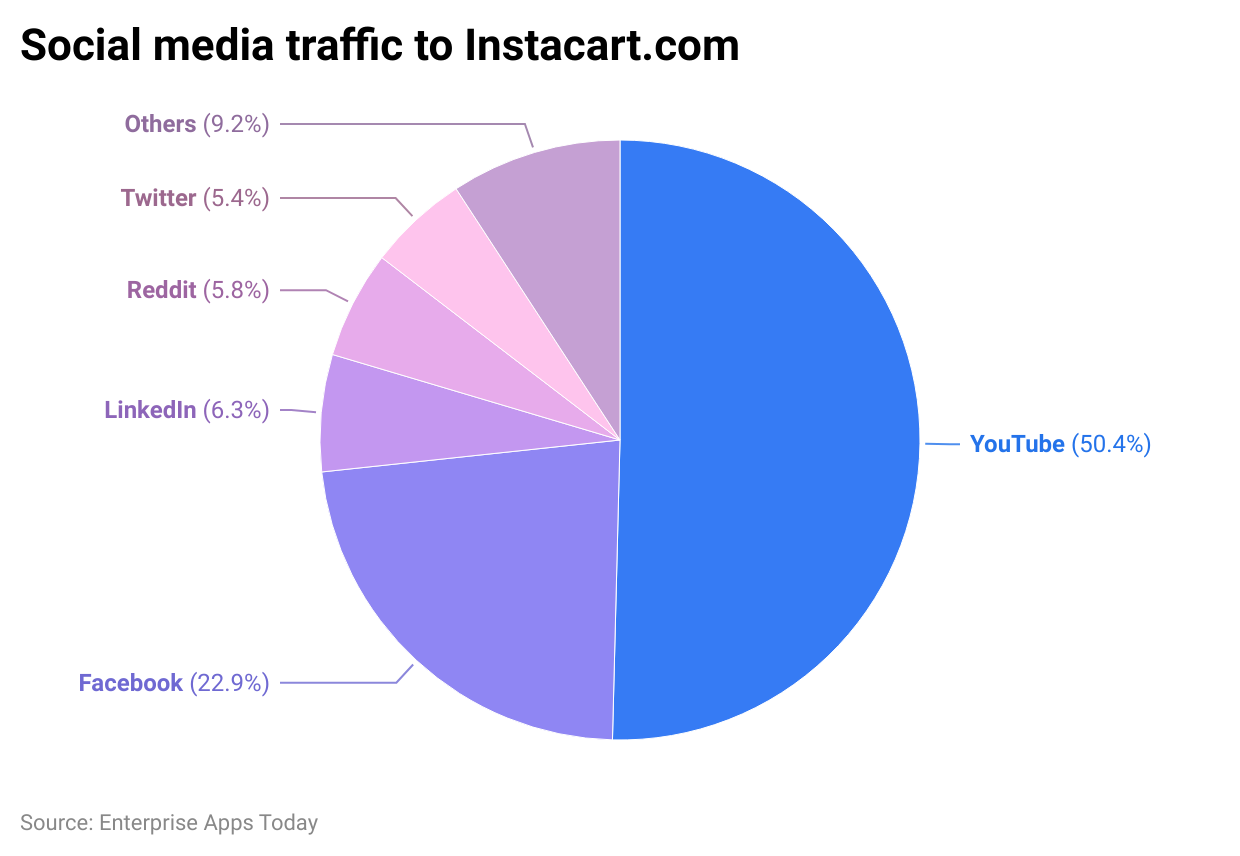
(Reference: usesignhouse.com)
As stated by Instacart Statistics, the majority of the website traffic is sent by referral on YouTube. Furthermore, other social media networks contribute as follows Facebook (22.9%), LinkedIn (6.3%), Reddit (5.8%), Twitter (5.4%), and others (9.2%).
Conclusion
Instacart-like delivery apps delivered products to doorsteps during the lockdown period and filled the homes of consumers with happiness. Since lockdown, they have gained major brand awareness in the United States of America and Canada. As of 2023, Instacart is one of the leading delivery service providers and is expected to remain at the same level in coming years as observed by Instacart Statistics. Because of technology and changing trends, we can get everything delivered to our home steps today. Well, the competition is cutthroat, and to keep up with demand and supply, companies like these should always be on their toes.
FAQ.
Yex. For same-day delivery, the fees start from $3.99 for orders above $35. Delivery charges depend on the club store deliveries, one-hour delivery, or deliveries under $35.
Yes. While placing the order consumers can choose the way they want their order to get delivered. However, “Leave at my door” is a default setting. Consumers don’t need to attend their deliveries, the delivery executive will deliver the order at the door, and the app will inform you about the status.
Orders for alcohol, high-value items, or prescription items wouldn’t be completely contactless, because the delivery executives will be asked to check IDs upon delivery.
Instacart is delivered almost everywhere in Canada and the United States of America. However, the deliveries are not available in some areas. You can check your area if it is eligible for delivery on this link. Grocery Delivery near me.
Instacart can deliver the orders between 1 hour to 5 hours. The delivery charges of the same may vary.
Instacart personal shoppers get paid between $8 to $22.24 per hour. The amount of payment depends on the independent contractor. On average, an independent driver earns $15,000 a year while a delivery driver earns around $66,046 a year.
On the app, customers can select the store where they want to buy groceries or food items. Then add the items one by one, and make a payment, once the order is placed, a personal shopper will be assigned to deliver the order within the selected period of delivery.

Barry is a lover of everything technology. Figuring out how the software works and creating content to shed more light on the value it offers users is his favorite pastime. When not evaluating apps or programs, he's busy trying out new healthy recipes, doing yoga, meditating, or taking nature walks with his little one.
