Instagram Stories Statistics By Country, Demographics, Sponsored Campaign, Platform, Activities on Instagram and Influencer Marketing Strategy
Page Contents
- Introduction
- Editor’s Choice
- What are Instagram Stories?
- Features of Instagram Stories
- How To Make Money On Instagram?
- General Instagram Stories Statistics
- Instagram Stories Statistics by Business
- Instagram Stories Statistics by Country
- Instagram Stories Statistics Demographics
- Instagram Stories Statistics by Platform
- Instagram Stories Statistics by Sponsored Campaign
- Instagram Stories Statistics by Activities on Instagram
- Instagram Stories Statistics by Influencer Marketing Strategy
- Instagram Stories Statistics by Preferred Type of Stories
- Conclusion
Introduction
Instagram Stories Statistics: Social media networks are a great way to reach new people and markets without any additional costs. Using hashtags and mentions, an organic crowd is gathered. Today, it has become an easier way to attract more customers and improve the business. It is not only Instagram but other social media networks such as Facebook, Snapchat, YouTube are also booming all over the place. IG Stories are a great way to advertise products and promote posts or reels.
Check out some below-mentioned interesting Instagram stories Statistics with bonus content on how to make money using Instagram.
Editor’s Choice
- IG accounts with more than 500 followers get benefited from four stories, three posts, and one reel every week.
- Instagram Stories Statistics further state that, 70% of IG stories are watched with sound on.
- 1 out of 3 users stated they wanted to buy the product advertised on their Instagram Story.
- 60% of businesses that keep stories use @mentions, poll stickers, and hashtags at least once in their every story.
- Using IG Stories for business increases conversion, whereas keeping longer frames reduces the retention rate.
- 39% of users in Gen Z and 31% of millennials include Instagram Stories in created content.
- 31% of the IG Budget is allocated to ads on stories by marketers in the United States of America.
- In the United States of America, 96% of marketers are planning to use stories in the coming future.
- The average length of IG stories for 60% of brands is 1 to 3 frames.
- Instagram Stories Statistics state that IG stories have a lower reach rate of 1.2% to 5.4% than Instagram posts of 9% to 20%.
What are Instagram Stories?
Instagram Stories or IG Stories is a quick way to share any kind of content on the platform. It allows you to display your content using GIFs, music, text, or stickers. These stories are posted on the platform for 24 hours and you can also view them later by adding them into Highlights. Just like WhatsApp has Status, Instagram has Stories. Instagram Stories appear this way on the platform.
Features of Instagram Stories
- Your creativity has a platform.
- Increased organic base.
- You get an option to advertise in between stories to increase your sale.
- Easy swipe-up link connected to your website.
- Eye-catchy stickers.
- Countdown sticker
- Emoji Slider
- You can ask for FAQs in the poll.
- Location as well as geolocation hashtags.
- Promote your posts or reels.
- You can explain multiple things in 15 seconds story.
How To Make Money On Instagram?
- Increase your number of followers and views for every reel, you can do it by promoting your reel on stories, once you have gained proper views on all your reels, you are eligible for monetization.
- Become an influencer and earn money from sponsored posts.
- Promote your brand on Instagram Stories advertisement, which increases the total number of conversions.
- Collaborate with brands.
- Try affiliate marketing.
- Sell content writing services for social media posts.
General Instagram Stories Statistics
- In the United States of America, 17% of users prefer Instagram Stories while 13% prefer Snapchat.
- Instagram Stories Statistics state that IG stories have a lower reach rate of 1.2% to 5.4% than Instagram posts of 9% to 20%.
- Instagram Stories with more than 26 frames have a 2% exit rate.
- Instagram Stories Statistics further state that, 70% of IG stories are watched with sound on.
- Around 50 billion users watch stories every day.
- Putting 5 IG Stories every day increases the retention rate by 70%.
- Every day, 36.19% of men and 68.1% of women use Instagram Stories.
- The retention rate for stories begins to lower by 75% after 6th frame.
- IG accounts with more than 500 followers get benefited from four stories, three posts, and one reel every week.
- Instagram Stories make up around 25% of all the content on the platform.
- Instagram personal Stories are viewed by 55% of users.
- Only 19% of users watch Instagram stories in full.
- Influencers earn around $43 to $721 for their Instagram stories.
- Out of all IG users, 86.6% of users post on Stories.
- 1 out of 3 users stated they wanted to buy the product advertised on their Instagram Story.
- 40% of Instagram Users post stories every day.
- On average, 28 minutes are spent watching stories each day.
Instagram Stories Statistics by Business
- Using IG Stories for business increases conversion, whereas keeping longer frames reduces the retention rate.
- In the United States of America, 96% of marketers are planning to use stories in the coming future.
- In addition, 50% of the brands around the world, post stories at least once per month.
- Around 58% of the users, clicked on the ads they saw on IG stories.
- 31% of the IG Budget is allocated to ads on stories by marketers in the United States of America.
- The best time to post on Instagram Stories is between 4 am to 6 am.
- The average length of IG stories for 60% of brands is 1 to 3 frames.
- Moreover, on average 10 stories are posted by brands every month.
- 44% of businesses use Instagram Stories to promote services or products.
- 60% of businesses that keep stories use @mentions, poll stickers, and hashtags at least once in their every story.
- Most active brands found on Instagram post around 17 stories every month.
- The projected ad audience on Instagram Stories is 996 million.
- Around 85 million Americans watch Instagram stories.
- Instagram ads appearing on stories make up to 35% of total ad impressions.
- Around 4 million brands are using story ads every month.
- According to reports, stories that are shot on mobile are 63% more successful than studio-shot ads.
Instagram Stories Statistics by Country
 (Source: Statista)
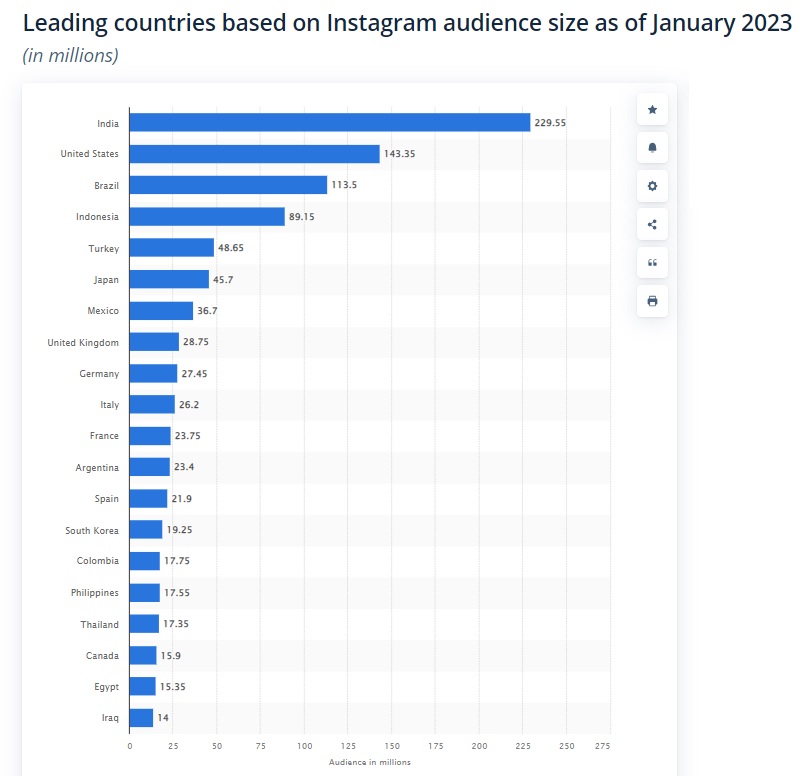
- As of January, India contributed 229.55 million active Instagram users followed by the United States of America (143.35 million) and Brazil (113.5 million).
- Other names in the countries with the most Instagram users as of January 2023 are Indonesia (89.15 million), Turkey (48.65 million), Japan (45.7 million), Mexico (36.7 million), United Kingdom (28.75 million), Germany (27.45 million), Italy (26.2 million), France (23.75 million), Argentina (23.4million), and Spain (21.9 million).
- Additional countries with less than 20 million users are South Korea (19.25 million), Colombia (17.75 million), the Philippines (17.55 million), Thailand (17.35 million), Canada (15.9 million), Egypt (15.35 million), and Iraq (14 million).
Instagram Stories Statistics Demographics
- 39% of users in Gen Z and 31% of millennials include Instagram Stories in created content.
- 60% of millennials either watch or publish Instagram stories.
(Source: Statista)
Instagram Stories Statistics by Platform
(Source: startupbonsai.com)
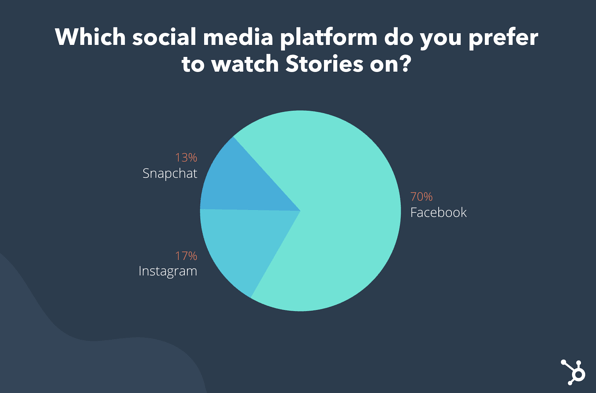
- According to Instagram Stories Statistics, around 17% of the users prefer IG to watch stories.
- Whereas, 13% of the users prefer Snapchat.
- And around 70% of users love to watch stories on Facebook.
Instagram Stories Statistics by Sponsored Campaign
(Source: Backlinko.com)
- The majority of the influencers around the world resulting in 55.4% use Instagram stories to support sponsored campaigns.
- Whereas, some influencers use story highlights (26%), Instagram Polls (15.9%), and Instagram Swipe Up features (15.3%).
- Around 13% of influencers refrain from posting organic content to give sponsored content primary exposure on your feed.
- Only 2.7% use other options while 37.4% do not use any of the above features.
Instagram Stories Statistics by Activities on Instagram
(Source: financesonline.com)
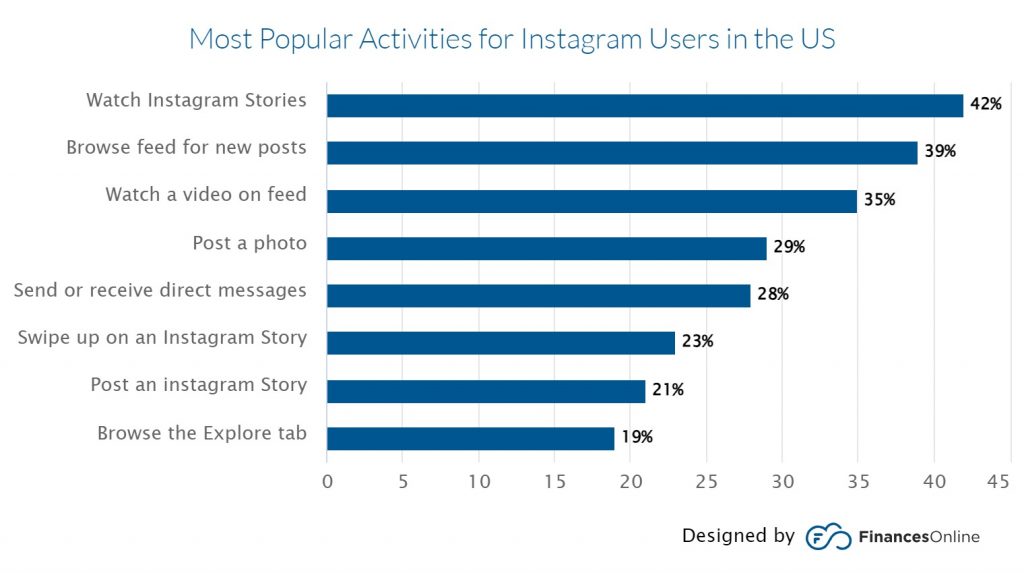
- The top three popular activities for Instagram users in the United States of America include Watch Instagram Stories (42%), browsing feeds for new posts (39%), and Watching a video on Feed (35%).
- Additional popular activities are posting a photo (29%), Sending or receiving direct messages (28%), and Swiping up on Instagram Story (23%).
- Posting an Instagram story has been preferred by only 21% of users in the United States of America.
- And 19% of Americans browse the Explore tab.
Instagram Stories Statistics by Influencer Marketing Strategy
- Instagram influencers around the world prefer IG post features for influencer marketing.
- Whereas 73% of the influencers use Instagram Stories.
- On the other hand, some of them use a completely different platform as their marketing strategy by using YouTube videos resulting in 56%.
Instagram Stories Statistics by Preferred Type of Stories
The most preferred type of Instagram Stories are Short narrative stories including text, videos, and photos, and stories focusing on polls and quizzes. The majority of the users have also mentioned that they don’t have any preference for types of Stories on IG.
Conclusion
Increasing your business has never been easy due to these social media networks and technology. Nowadays, freelancers are also able to successfully grab projects by tagging and regularly posting on Instagram. One of the most famous graphic designers is named Anik is just a university student with a handle @anikjaindesign and has gained a 168K fanbase and opened his own office. Instagram is extremely useful for businesses as well, you can promote your dishes if you have a restaurant or just advertise your products if you run a clothing business. If you still don’t have your identity on IG, go to www.instagram.com and join the world of fun.
FAQ.
You can follow the below schedule to post a reel, story, or post for better reach.
On Monday and Wednesday between 10 am to 3 pm.
On Tuesday between 10 am to 4 pm.
On Thursday between 10 am to 3 pm
On Friday between 10 am to 2 pm.
On Saturday between 10 am to 12 pm.
And on Sunday between 9 am to 3 pm.
This will help you to reach more accounts organically and increase followers as well as views and likes.
Consider following tips to increase followers using Instagram stories.
- Regularly post stories on IG.
- Mention other accounts in your stories.
- Add hashtags.
- Create interactive stories.
- Keep an eye on the algorithm of Instagram.
- Use stickers.
- Reply to users to messages received from the stories section.
- Do not overflow the stories, keep it simple and minimum.
- Create various templates and apply them to stories.
If you have been continuously posting stories take one or two days of break before posting another one.
These features are only available on mobile devices such as iOS and Android, including Instagram Lite App. It is not available on web browsers.
- To hide Instagram Stories from a specific person go to Profile Picture in the bottom right.
- Then tap three bars in the top right and open Setting and Privacy.
- In this option, click, who can see your content tap on Hide story or live from and select the name.
- Click Done once the process is completed.
Sharing someone else’s post to your own Instagram Story is only allowed if the account is public and allowed resharing of their posts. You can share the post from the share button . And tap on add post/ video/ reel to your story and click done.

Barry is a lover of everything technology. Figuring out how the software works and creating content to shed more light on the value it offers users is his favorite pastime. When not evaluating apps or programs, he's busy trying out new healthy recipes, doing yoga, meditating, or taking nature walks with his little one.


