LGBT Statistics – By Suicide Rate, Workplace, Region, County, State, Demographics, Anti-LGBTQ Threats, Industry
Page Contents
- Introduction
- Editor’s Choice
- What is LGBT Community?
- General LGBT Statistics
- LBGT Statistics by Suicide Rate
- LBGT Statistics by sexual violence
- LGBT Statistics by Workplace
- LGBT Statistics by Region
- LGBT Statistics by Country
- LGBT Statistics By States
- LGBT Statistics By Legal Procedure
- LGBT Statistics By Demographics
- LGBT Statistics By Brand Advertising Opinion
- LGBT Statistics By Characters on OTT Platforms
- LGBT Statistics by Anti-LGBTQ Threats
- LGBT Statistics by Industry
- Conclusion
Introduction
LGBT Statistics: As we are changing our lifestyles, new concepts are being introduced into our lives. In recent years, the LGBT community has gained major importance around the world. Not all countries support same-sex marriage or related kinds of activities but in some countries, same-sex marriage has been legalized. These LGBT Statistics will guide on some events experienced by the LGBT community focusing on the American region.
Editor’s Choice
- In the United States of America, as of 2023, around 13,024,000 of the population is LGBTQ+, meaning there are 3,893 people for every 100K LGBTQ population.
- Homeless LGBT youth are more likely to commit suicide resulting in 62% compared to 29% of the homeless heterosexual population.
- Gen Z has increasing contributions to LGBT Community resulting in 15%, whereas millennials contribute by 6%.
- As of 2022, there is a total of 68 countries in the world that criminalize homosexuality.
- LGBT Statistics state that, the most common legal procedure for same-sex marriage by legalization is Legislation.
- Majority of the LGBTQ+ employees are not comfortable coming out with their colleagues.
- 33% of LGBT+ employees have experienced non-inclusive behavior at the office and in remote work environments while 42% experienced it at work.
- The population in the LGBTQ+ community is 2 to 6 times more likely to commit suicide than the heterosexual population.
- In the United States of America, as of 2022, 71% of people agree to same-sex marriages should become legal and recognized as valid.
- Young Gen Zers are more likely to identify themselves as LGBT compared to older people in Gen Z.
What is LGBT Community?
LGBT stands for Lesbian, Gay, Bisexual, and Transgender. This community does not include people who are heterosexual, meaning, such people who are attracted to the opposite gender (similar to the same sex as birth). Unlike in the old days, the support community for LGBT has increased in the countries such as Australia, Canada, the United States of America, and some European countries. On the other hand, even today, in many countries being LGBTQ is termed a crime. Recently, a new term in LGBT was introduced as LGBTQ+ where Q stands for queer. The term LGBT is in use since 1990.
General LGBT Statistics
- As of 2022, there is a total of 68 countries in the world that criminalize homosexuality.
- On the other hand, around 32 countries in the world have legalized same-sex marriage.
- Transgender women are more likely to face hate crimes resulting in 2.5%.
- In the United States of America, as of 2022, 71% of people agree to same-sex marriages should become legal and recognized as valid.
- Moreover, LGBT Statistics state that, 25% of Americans said being lesbian or gay is not morally acceptable while 71% have positive thoughts about being lesbian or gay.
- Between 2021 to 2022, around 25 characters were featured on prime-time broadcasts and various streaming television shows playing the role of non-binary.
- Around 14.7% of same-sex couples have at least one child in their household.
- LGBT Statistics state that, as of 2022, 7.1% of adults in the United States of America self-identified as LGBTQ.
- Gen Z has increasing contributions to LGBT Community resulting in 15%, whereas millennials contribute by 6%.
- Young Gen Zers are more likely to identify themselves as LGBT compared to older people in Gen Z.
- In the United States of America, as of 2023, around 13,024,000 of the population is LGBTQ+, meaning there are 3,893 people for every 100K LGBTQ population.
- 6 out of 10 Americas support the LGBTQ community.
- Around 4% of LGBTQ parents have adopted a child in the United States of America.
LBGT Statistics by Suicide Rate
- LGBT Statistics estimate that every year around 1500 lesbian and gay young commit suicide.
- More than 50% of the youth in the lesbian and gay community said that they have attempted suicide more than once.
- Suicide is the leading cause of death in the LGBTQ+ community.
- The population in the LGBTQ+ community is 2 to 6 times more likely to commit suicide than the heterosexual population.
- Moreover, 30% of the gay population attempt suicide at the age of 15.
- Homeless LGBT youth are more likely to commit suicide resulting in 62% compared to 29% of the homeless heterosexual population.
LBGT Statistics by sexual violence
- Around 58.7% of homeless LGBT youth have experienced sexual violence against them as compared to 33.4% of homeless heterosexual people.
- Homeless LGBT people are living at risk of mental health problems, victimization, and unsafe sexual practices.
- Moreover, LGBT Statistics state that, these people are 7.4 times more likely to fall prey to sexual violence.
- 20% of homeless people are from the LGBT community.
- The LGBT population is 2X more likely to face sexual abuse before the age of 12.
LGBT Statistics by Workplace
- 16% of LGBTQ community center board members are identified as transgenders.
- 82% of the LGBT+ employees feel allyship helps them to be out at their work.
- 26% of the LGBT employees said they have come out to only a few colleagues, and the majority of others don’t know about them.
- On the other hand, 17% of LGBTQ+ employees are not open about their identity at their workplace.
- Whereas 43% of the employees are open in their workplaces.
- Majority of the LGBTQ+ employees are not comfortable coming out with their colleagues.
- 33% of LGBT+ employees have experienced non-inclusive behavior at the office and in remote work environments while 42% experienced it at work.
- 15% of women and 30% of men in the LGBTQ community say that their sexual orientation will negatively harm their career development.
- 20% of LGBT people face discrimination while applying for a job in the United States of America.
(Source: Statista.com)
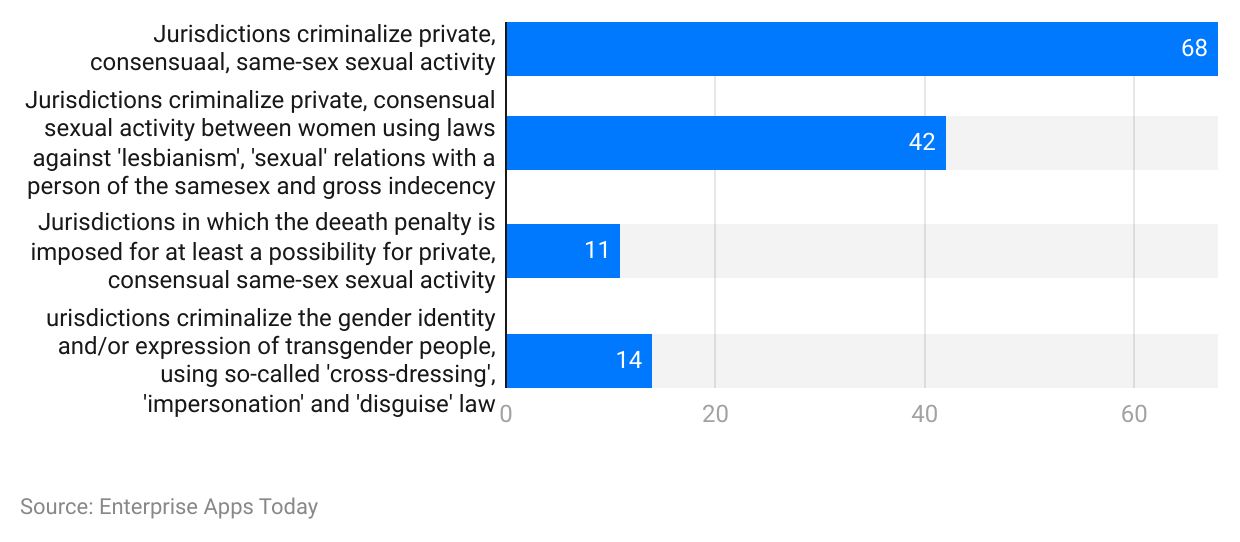
- As of 2022, 68 jurisdictions criminalize any kind of same-sex sexual activity.
- 42 countries criminalize consensual or private sexual activities or any other activities similar act between same-sex persons.
- In 11 countries as of 2022, the death penalty is imposed on similar kinds of activities.
- And 14 countries criminalize similar activities using cross-dressing, impersonation, and disguise laws.
LGBT Statistics by Region
(Reference: Statista.com)
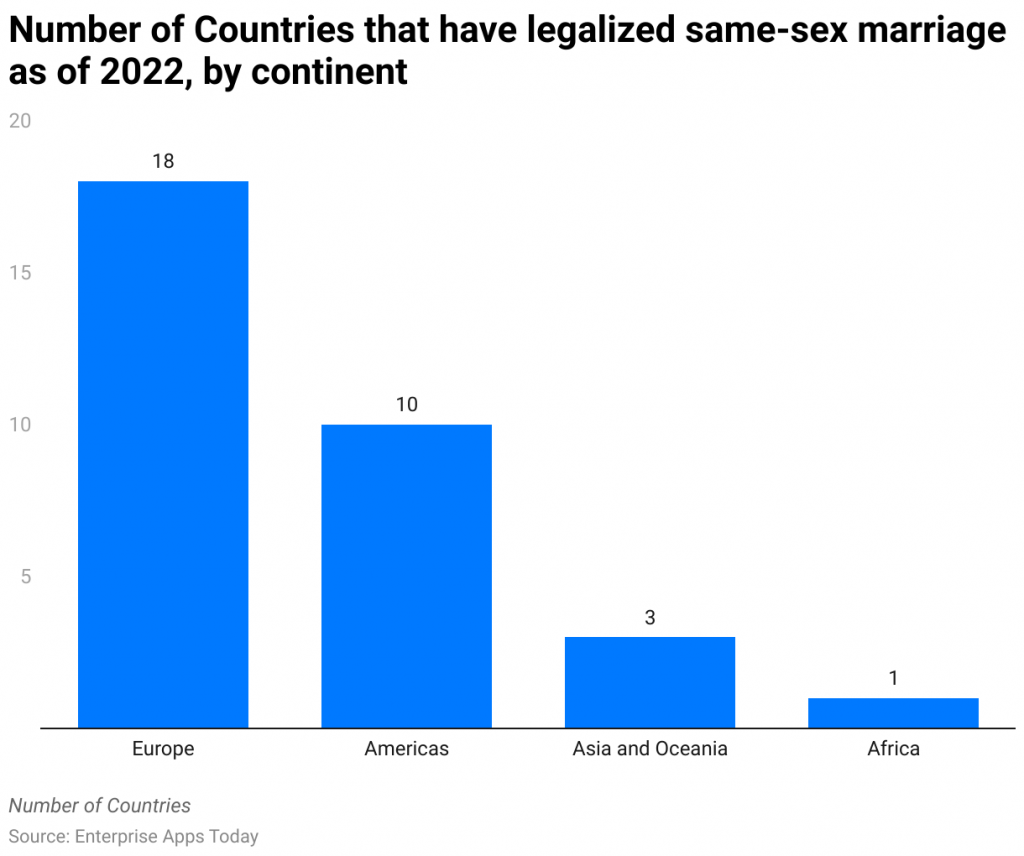
- LGBT Statistics further state that, as of 2022, in Europe, 18 states support same-sex marriage.
- Whereas, in the United States of America 10 states and 3 countries in Asia and Oceania support same-sex marriage.
- In Africa, only 1 state is supporting same-sex marriage as of 2022.
LGBT Statistics by Country
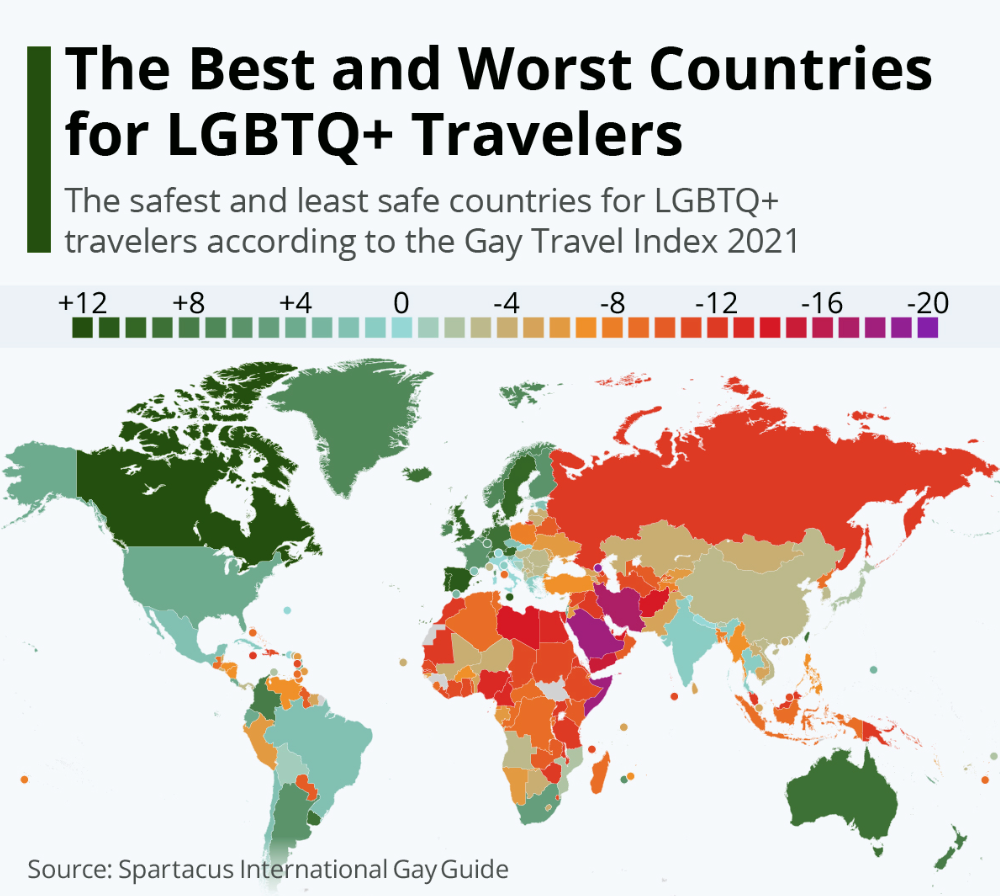
- LGBT Statistics further states that as of 2022 in Latin America, including Mexico, Peru, Colombia, Brazil and Argentina, 27% of the consumers said that the brand they use should promote inclusion and diversity in LGBTQIA+ Community.
LGBT Statistics By States
(Reference: worldpopulationreview.com)
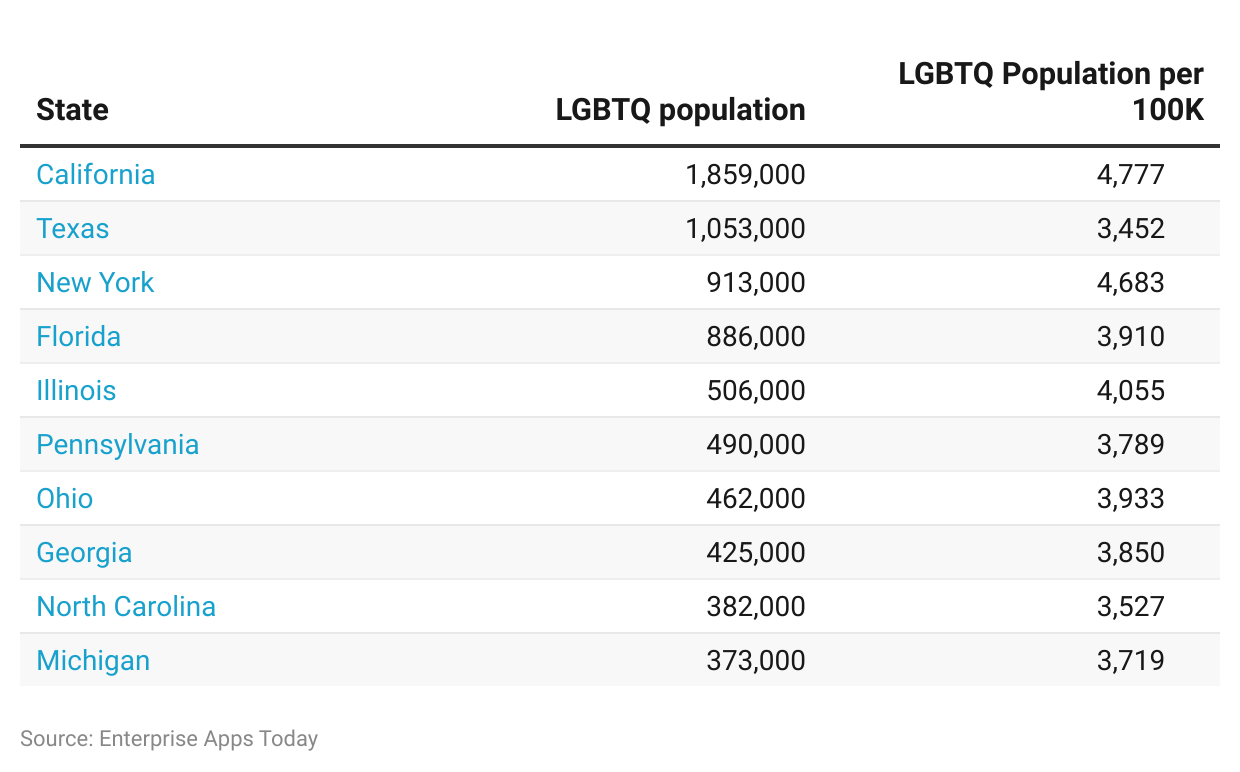
- The top three States in the United States of America, with the highest LGBTQ population for every 100K LGBTQ population are California (1,859,000), Texas (1,053,000), and New York (913,000).
- Other States in the USA include the following number of LGBTQ populations Florida (886,000), Illinois (506,000), Pennsylvania (490,000), Ohio (462,000), Georgia (425,000), North Carolina (382,000), and Michigan (373,000).
LGBT Statistics By Legal Procedure
(Source: Statista.com)
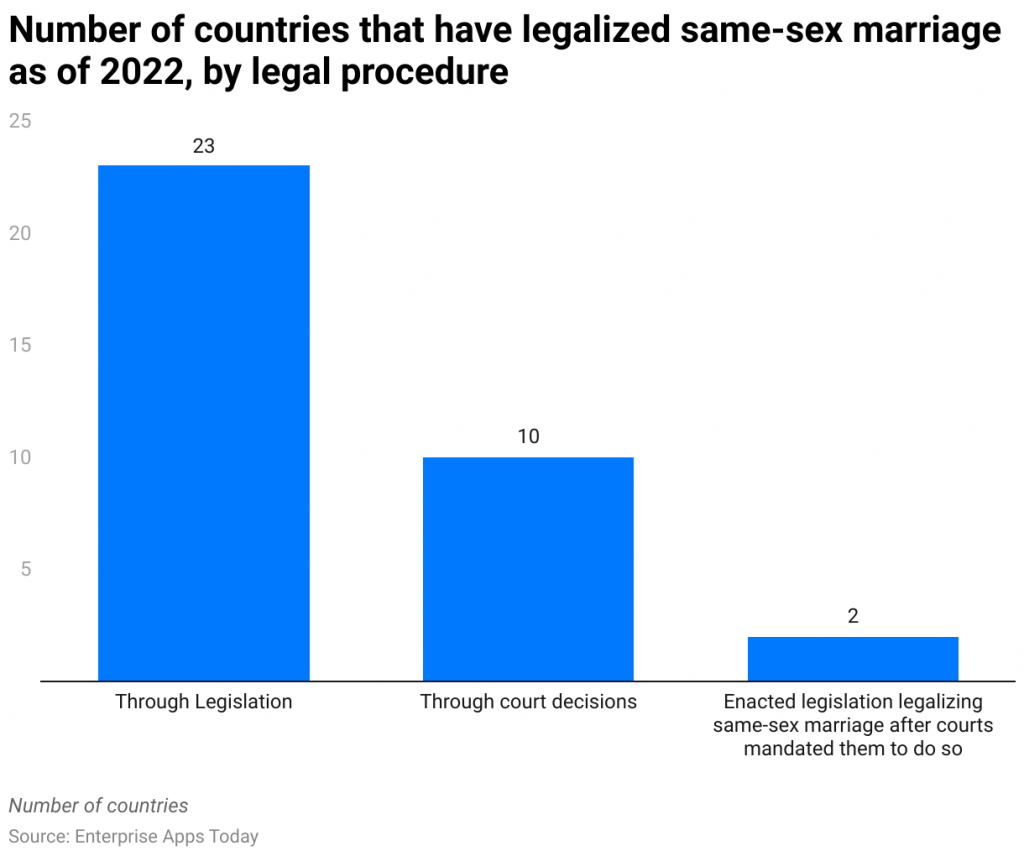
- LGBT Statistics state that, the most common legal procedure for same-sex marriage by legalization is Legislation.
- On the other hand, 10% of the countries support same-sex marriage through court decisions.
- And around 2% of countries approve after the court’s legislations mandate them to do so.
LGBT Statistics By Demographics
- 1 out of 6 people in Gen Z identify themselves as LGBTQ.
By Generation

(Source: Statista.com)
- As of 2022, in the United States of America, the majority of the population is heterosexual in all generations, followed by homosexual and bisexual. The least found sexuality by generation is the asexual and queer community.
(Reference: usatoday.com)
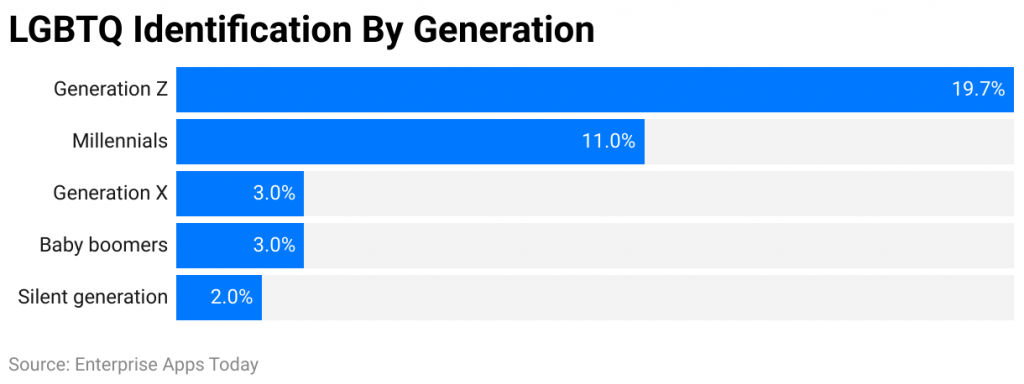
- As of 2022, in the United States of America, 19.7% of the population of Gen Z is LGBTQ.
- On the other hand, with a rising number of Millennials contribute around 11.2%.
- Gen X and Baby Boomers have an LGBT community respectively around 3.3% and 2.7%.
- Whereas the lowest number of LGBT people are in the silent generation resulting in 1.7% as of 2022.
By Ethnicity
(Reference: Statista.com)
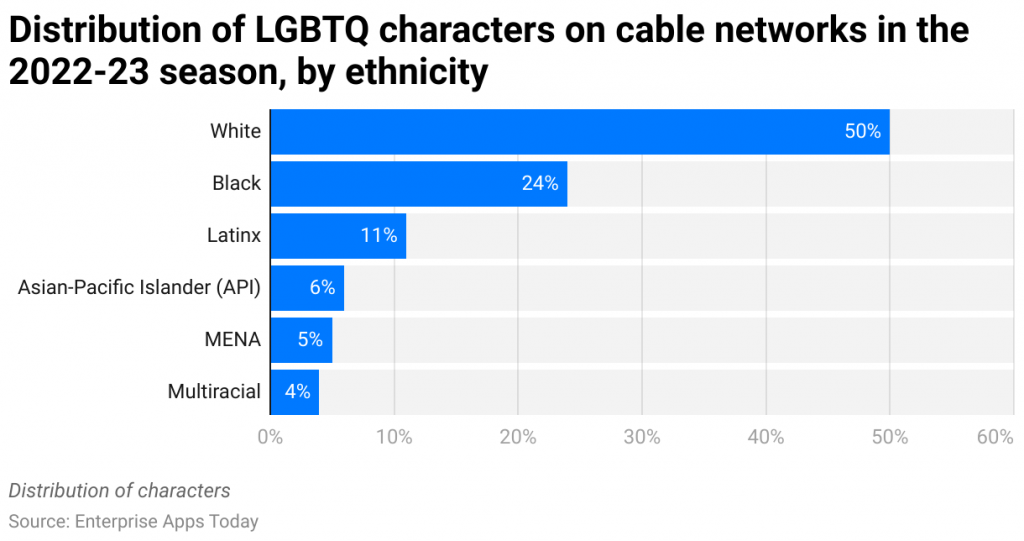
- 50% of LGBT Characters on cable networks as of 2022 in the United States of America were shown as white by ethnic background.
- 24% of the characters were black while 11% were shown as Latinx.
- Whereas 6% were shown as Asian Pacific Islanders and 5% were MENA.
- 4% of the LGBT characters were multiracial.
LGBT Statistics By Brand Advertising Opinion
(Reference: Statista.com)
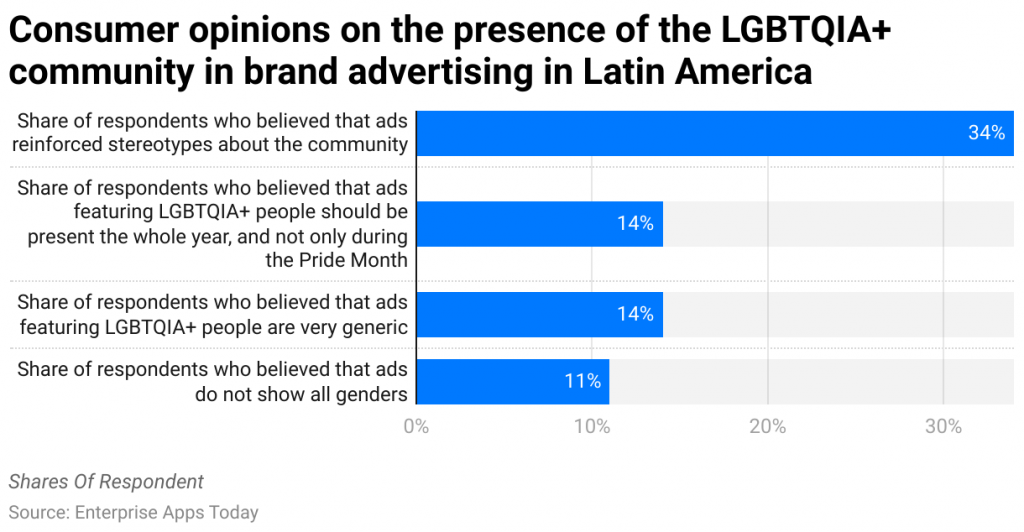
- The majority of consumers in Latin America as of May 2022 say that ads regarding LGBTQIA+ reinforce stereotypes about the community.
- On the other hand, 14% of the people had a similar opinion as Advertisements regarding LGBTQIA+ shouldn’t be only shown during Pride Month but should last for the whole year, and others said, these people in the community are very generic.
- 11% of Americans said LGBTQIA+ advertisements do not show all genders.
LGBT Statistics By Characters on OTT Platforms

- Considering the series on various OTT platforms, Netflix has shown the highest number of LGBTQ characters resulting in 155, between 2021 to 2022 in the United States of America.
- HBO Max presented 71 characters while there were 36 LGBTQ characters on Amazon Prime Video.
- Hulu represented around 36 LGBTQ characters in 2021-2022.
By Sexual Orientation
(Reference: Statista.com)
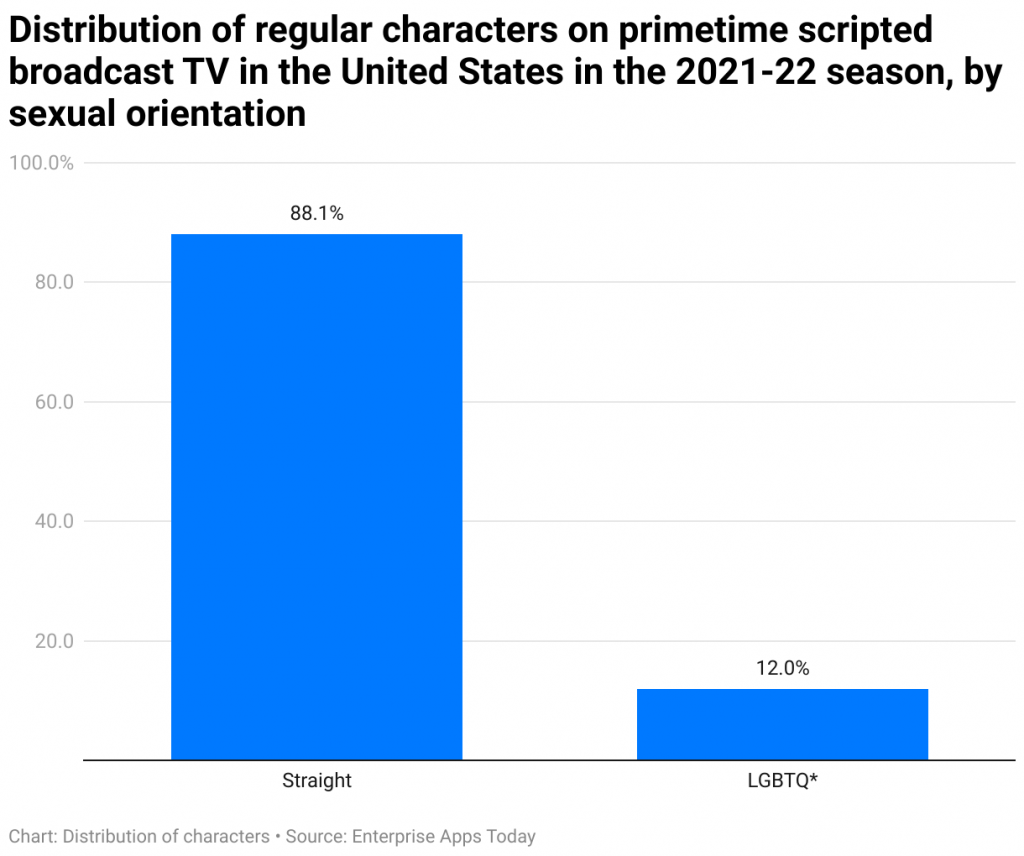
- As of 2021-2022 of primetime scripted broadcast television in the United States of America, the majority of the characters played the role as straight resulting in 88.1%.
- Whereas according to LGBT Statistics, 11.9% of characters were LGBTQ.
By primetime programs on the cable network in 2021-2022

(Reference: Statista.com)
- Between 2021-2022, the prime-time shows on cable networks included 35% of lesbian characters.
- Whereas in a similar period, 33% of the characters played a role as Gay while 31% were bisexual+.
- Whereas only 1% of the characters in prime-time programming on cable networks' sexual orientation was not determined.
LGBT Statistics by Anti-LGBTQ Threats
(Reference: mapresearch.org)
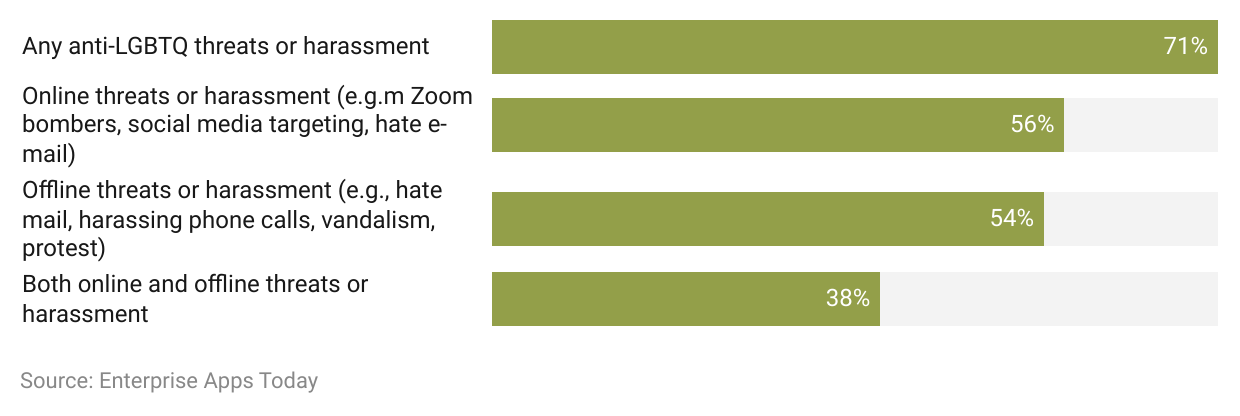
- 71% of the LGBTQ community received anti-LGBTQ threats or harassment as of 2022.
- 56% of the community received online threats or harassment in the form of hate e-mails, social media targeting, or Zoom bombers.
- Moreover, 54% of the LGTBQ+ youth received offline threats or harassment in the form of vandalism, protests, or harassing phone calls.
- And 38% of the community received threats or harassment in both forms such as online and offline.
LGBT Statistics by Industry
(Source: deloitte.com)
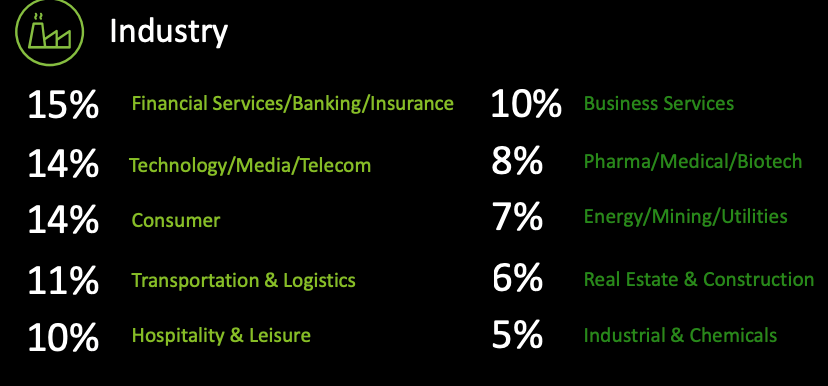
- The highest number of LGBT employees are working in financial services/ banking or insurance as of 2022 resulting in 15%.
- 14% of employees are in technology/ media and telecoms, while the consumer industry has similarly 14%.
- Other industries include the following number of LGBT employees: Transportation and logistics (11%), Hospitality and leisure (10%), business services (10%), Pharma/ medical/ biotech (8%), Energy/mining/ Utilities (7%), Real estate and Construction (6%), Industrial and Chemicals industry (5%).
Conclusion
When it comes to sexuality, it is a personal choice, and shouldn’t be taken in the wrong way by other people. People in the LGBT community are humans and deserve the same respect as others. Moreover, these LGBT Statistics show that many countries are yet to accept this concept legally. Majority of the Americans support the LGBTQ community. Digitalization has also progressed such communities by creating groups and staying together.
Sources
FAQ.
Companies ask such questions to maintain diversity and avoid discrimination in workplaces. But they are not legally allowed to force the candidate to an answer. If you don’t want to answer such a question, you can tick on ‘I do not wish to disclose’ and skip to the next page.
LGBT Prime Month celebration is typically observed in June every month. This is dedicated to lesbian, gay, bisexual as well as transgenders. The LGBT Pride Month started after the Stonewall Riots observed in a series of gay liberation protests in 1969.
It depends on you whether you want to come out or not. Moreover, before coming out, observe the environment around the workplace to understand how people react to avoid any kind of harassment. To be honest other employees have no legal right to offend or harass LGBT employees.
Queer, in fact, is a broad term, but in the LGBT community, it is referred to as an umbrella term. The original meaning of the word is peculiar or strange. In the 19th century, this word was spread against the people in the LGBT community.

By conducting scientific research, I write about illness, health and healthcare. As a professional medical writer, my experience includes creating feature articles for newsletters and websites as well as research news stories for doctors and researchers. Reading has been an integral part of me since childhood - I'm fan of "Friends" and the "Harry Potter series". Before this career, I was employed by a French multinational company. However, my passion for reading led me to pursue writing professionally; my first Amazon-published short story entitled "The envelope that changed our lives" has recently been released. In my free moments, I enjoy long bike rides around town.


