20+ Paid Holiday Statistics 2023 – By Industries, Geography, Length and Usage
Page Contents
- Paid Holidays – What Are They?
- Key Paid Holidays Statistics (Editor's Choice)
- Most Common Paid Holidays
- Paid Holiday Statistics By Length and Usage
- Paid Holiday Statistics By Industries
- Average Paid Holiday Statistics Per Year
- Paid Holiday Statistics by Age
- Paid Holiday Statistics By Geography
- Paid Holiday Statistics by county
- Paid Holiday Statistics By Schedule
- Conclusion
Paid Holidays – What Are They?
Paid Holiday Statistics: Paid holidays can be any religious, national, or state holiday that businesses decide to offer as paid days off to employees. The FLSA (Fair Labor Standards Act), which only regulates overtime pay, minimum wage, and vacation pay, does not require businesses to offer paid holidays.
While many holidays are federally or state-recorded, employers don't have to pay extra for employees or give them time off. It can be difficult for employees to find the most popular paid holidays.
This article will cover the most important statistics and facts about the average number of paid holidays in the United States.
Key Paid Holidays Statistics (Editor's Choice)
- In the United States, 46% of people choose not to take paid holidays.
- 6 days is the average number of paid holidays.
- 48% of businesses offer “floating” holidays, which allow staff members to observe the holiday of their choice.
- In the United States, only 3% of civilian employees get more than 14 days of paid holidays.
- According to a survey of three-quarters of American workers, it is crucial that companies offer paid holidays (74%), paid vacation time (76%), and paid sick days (74%).
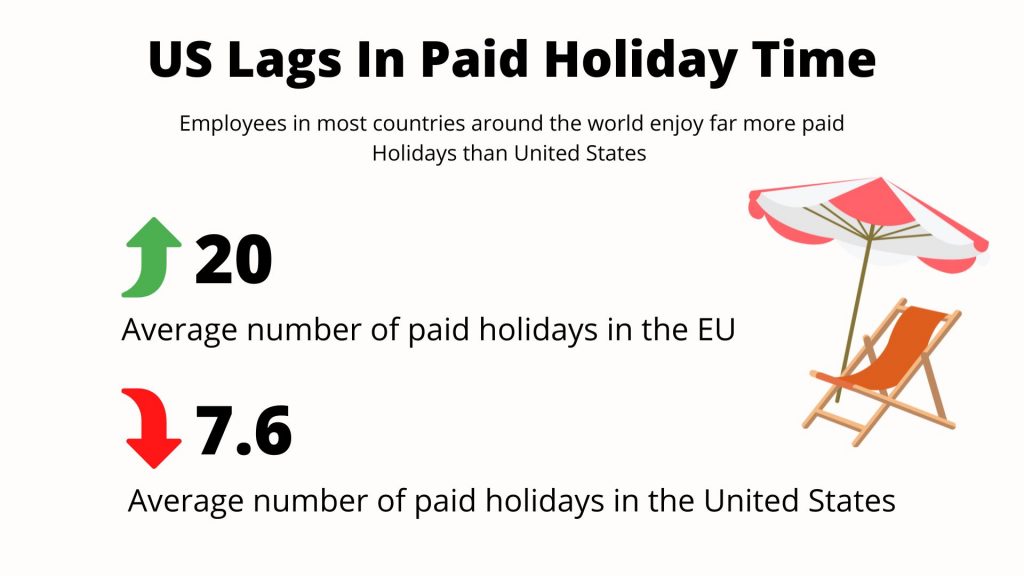
- An average worker in the United States receives 7.6 paid holidays.
- Only 54% of Americans say they use their paid time off for holidays or vacations, while 40% of Americans surveyed said this could be because they do not want to “return to a mountain of work.”
- The United States is the only advanced country in the world that does not guarantee its employees paid holidays. Approximately one in four American employees don't get paid holidays.
- Each year, about 430 million vacation days are left open for U.S. workers. That is 1,178,082 years of unused vacation time every year.
- The Northeast is a great region for paid holidays.
Most Common Paid Holidays
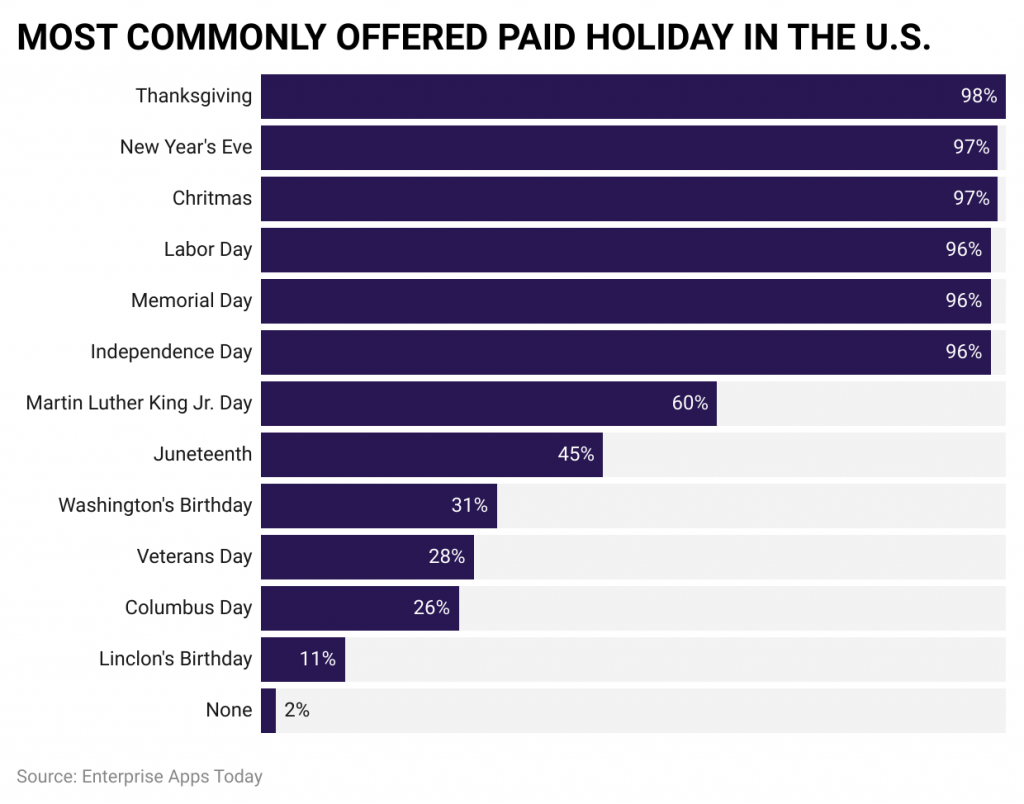
Even though the federal government does not require paid holidays, several businesses still use the following list of federal holidays to guide their policies. The most popular paid holidays in the United States include New Year’s Day, Independence Day, Christmas Day, Thanksgiving Day, Labor Day, and Memorial Day.
(Source: vacationtracker.io)
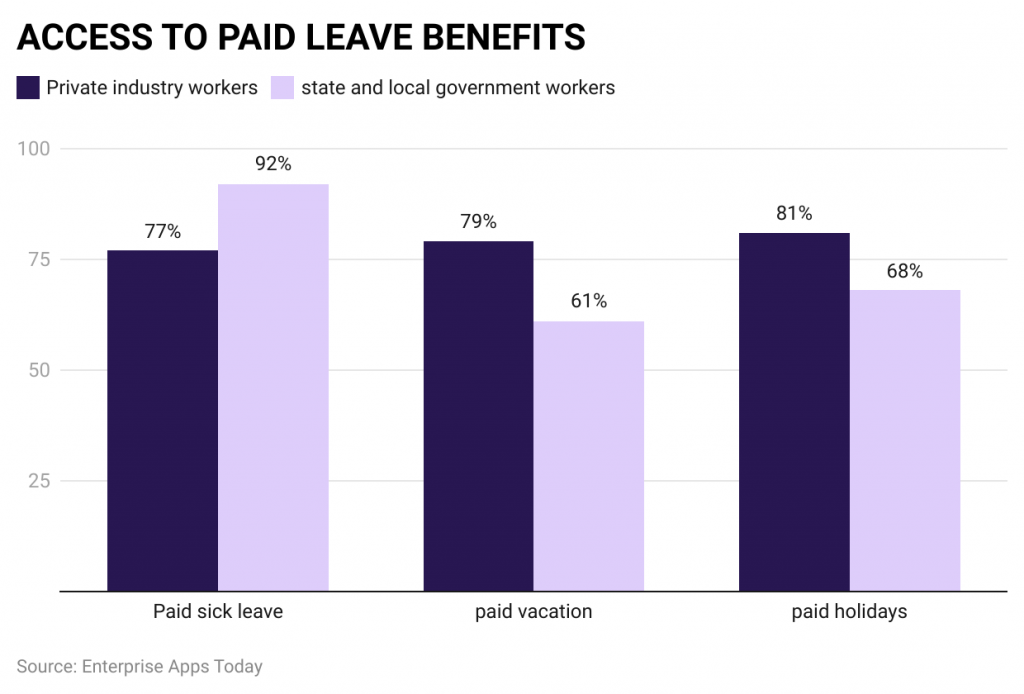
- As of 2023, paid holiday statistics are followed by private industry workers 81% and state and local government workers (68%)
- Christmas and Thanksgiving are the most often observed paid holidays, with 97% and 98% of civilian employees getting paid holidays to celebrate respectively.
- New Year’s Eve and Christmas Eve are much less received than their vacation counterparts, with roughly 30%of people in the U.S. getting paid holidays.
- Independence Day, which falls on the 4th of July, is the third most common paid holiday in the United States, with 96% of civilian employees receiving a paid holiday to enjoy barbeque and traditional fireworks.
- 96% of all civilian workers get a paid holiday on Memorial Day, which frequently results in a three-day weekend.
- 97%of all civilian employees get a paid holiday on 1st January, which is New Year’s Day.
- 96%of people in the U.S. get a holiday to celebrate American workers: Labor Day, the first Monday in September.
- 11%of civilian workers get a paid holiday on President’s Day (Third Monday in February).
- 60%of civilian workers get a paid holiday in honor of civil rights activist Martin Luther King, Jr.'s birthday on the third Monday in January.
- Other most commonly offered paid holidays in the United States in 2023 are followed by Juneteenth (45%), Washington’s Birthday (31%), Veterans Day (28%), Columbus Day (26%), and none (2%).
 (Source: vacationtracker.io)
Paid Holiday Statistics By Length and Usage
The length of paid holidays may differ based on the nature of the job, the number of hours worked, company size, and other factors. However, the maximum averages in 2023 range from six paid holidays.
#1. In the United States, 46% of people choose not to take paid holidays.
Only 54% of Americans say they use their paid time off for holidays or vacations, while 40% of those surveyed said this could be because they do not want to “return to a mountain of work.”
#2. Around 6 days is the average number of paid holidays.
Statistics demonstrate that 21% of U.S. workers get six paid holidays annually, despite the national average being 7.6.
#3. One in Four workers doesn't get paid holidays.
You can do the math, and you'll see that almost 40 million individuals are not getting paid holidays for Thanksgiving, Christmas, or any other federal holiday.
#4. 48% of businesses offer “floating” holidays, which allow staff members to observe the holiday of their choice.
Some companies offer additional paid holidays.
#5. Only 3% of civilian employees in the United States get more than 14 days of paid holidays.
Having more than two weeks of paid vacation may be the dream, but it is incredibly rare.
Paid Holiday Statistics By Industries
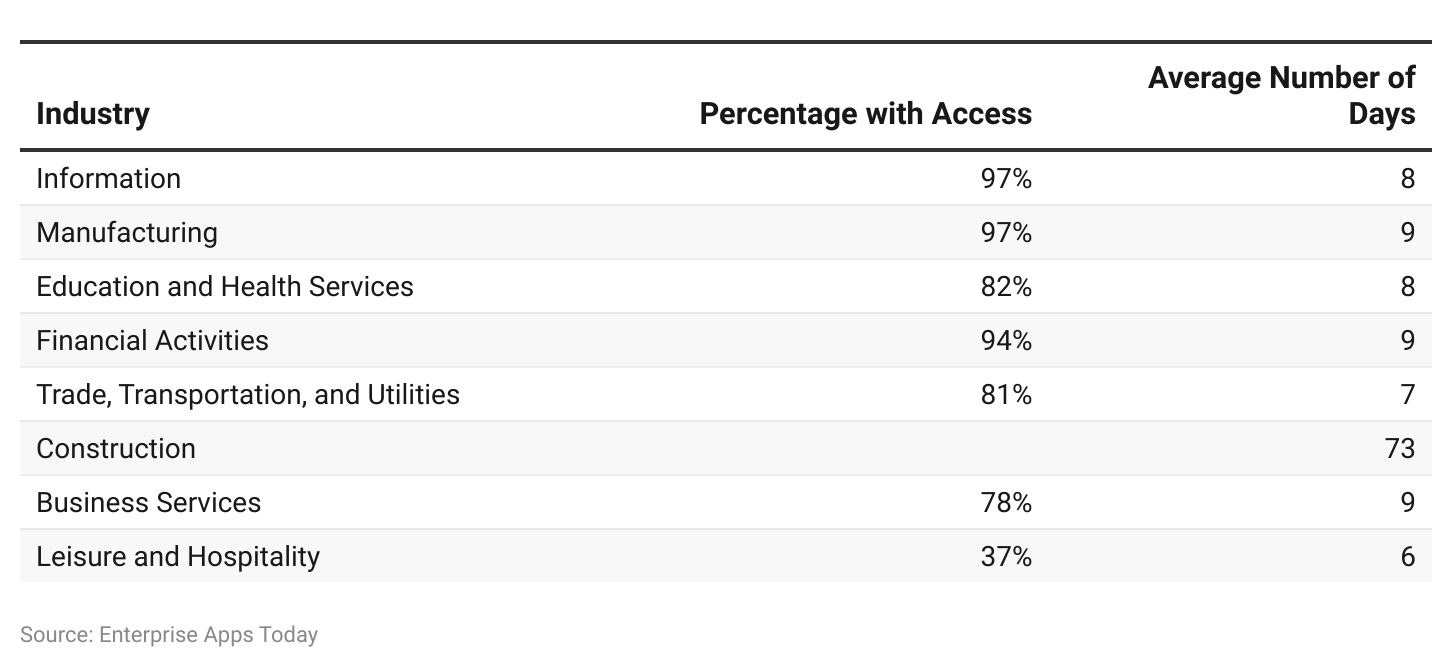
We have the answers to your questions about which industries offer the most generous paid holiday and which ones fall short in this regard. Manufacturing jobs have the best overall paid holiday stats, while the hospitality and leisure industries fall behind in nearly every aspect.
#6. The Financial and Manufacturing Activities industries give the most paid holidays.
These industries offer an average of nine paid holidays. This is two additional days over the most common averages.
#7. The worst for paid holidays is the Hospitality and Leisure sector.
Compared to other industries, this one lags far behind with only 37% of employees receiving paid holidays. Additionally, the average number of paid holidays is six.
#8. The manufacturing sector has the best-paid holidays for workers.
Manufacturing jobs are the best in this regard, with an astonishing 97% of workers having access to an average of 9 paid holidays.
#9. The Financial and Information businesses offer outstanding access.
Around of employees in the Financial Activities sector and 97% of employees in the Information, sector is offered access to paid holidays with 9 days and 8 days in both the Financial and Information sectors respectively.
#10. Construction, Transportation, Utilities, and Trade are all good.
These industries offer an average of seven paid holidays. Nearly 73% of workers in the construction industry have access to paid holidays, compared to 81% of those in the trades, transportation, and utilities have access.
 (Source: Zippia.com)
Average Paid Holiday Statistics Per Year
As of 2023, in the United States after 5 years of service, the average number of paid holidays has turned around 15 days, after 10 years of service resulted in 17 days of paid holidays, and after 20 years of service (20 days).
On the other hand, in the same year, full-time workers per year resulted in 8 days and part-time workers received only 6 days of paid holiday.
However, after 1 year of service paid holiday statistics are followed by union workers (10 days), and non-union workers (7 days).
(Source: Zippia.com)
Paid Holiday Statistics by Age
As of 2023 in the United States, the average number of paid holidays is received by above 65 years and above old people with 13 days.
Other paid holiday statistics by age are followed by 18-24 years (6 days), 25-35 years (8 days), 35-44 years (9.5 days), 45-54 years (11 days), and 55-64 years (10 days).
Paid Holiday Statistics By Geography
The region and state where you work can significantly impact the number of paid holidays you receive from your employer, as well as the percentage of the population that does not get paid holidays.
 (Source: Zippia.com)
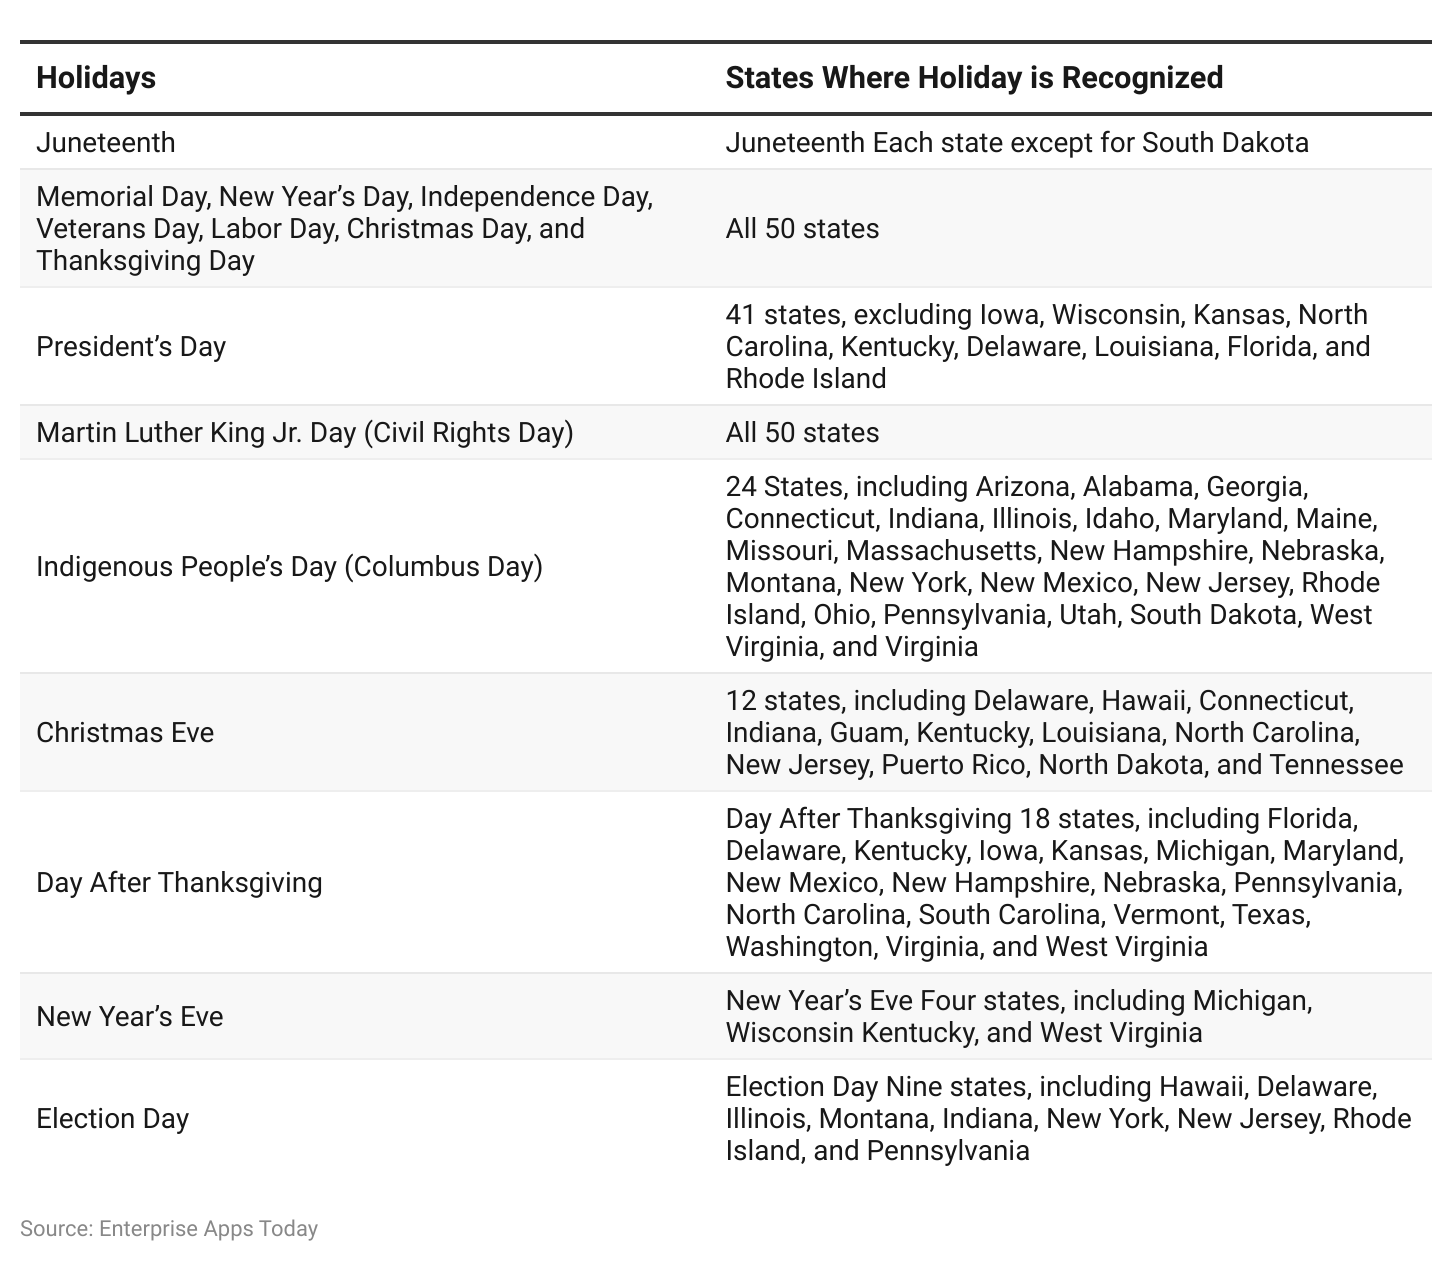
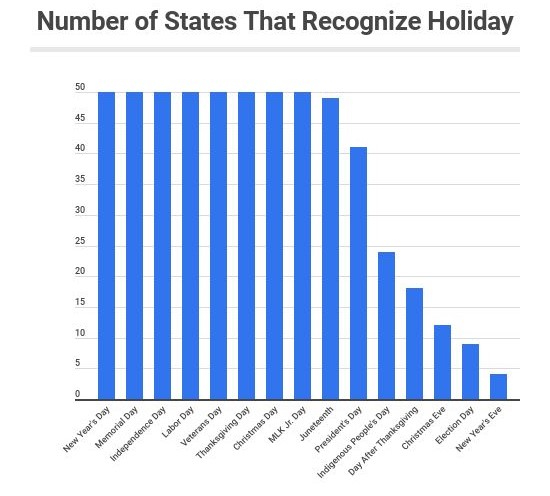
#11. The majority of states do not recognize or offer paid holidays for the day after Thanksgiving, Christmas Eve, Election Day, and New Year's Eve.
For each of these days, less than 20 states officially recognize it as a holiday. As a result, receiving paid holidays for them is uncommon.
#12. The Northeast is a great region for paid holidays.
Surveys show that New York, Maine, Massachusetts, Delaware, New Hampshire, Rhode Island, Connecticut, Vermont, Pennsylvania, and New Jersey are some states that provide the best paid holiday time, with an average of 11.4 days higher than the national average.
Furthermore, other paid holiday statistics by different U.S. regions are followed by West region (9.4 days), Midwest region (8.5 days), Southwest region (10 days), and Southeast region (8.5 days).
#13. In almost every state, these days are paid holidays.
No matter what state you live in, you should anticipate that your job offers paid holidays for Memorial Day, New Year's Day, Independence Day, Thanksgiving Day, Labor Day, and Christmas Day, as they are all legally recognized holidays in each state.
#14. The United States lags behind the rest of the globe.
In Finland, many workers are eligible for up to 30 paid holidays, compared to 7.6 days in the United States. Many other South American and European countries outperform the United States in this regard.
Paid Holiday Statistics by county
| Rank | Countries With the Most Paid Vacation | Total Vacation Days | Countries With Least Paid Vacation | Total Vacation Days |
| 1 | Iran | 53 | Micronesia | 9 |
| 2 | San Marino | 46 | Nauru | 10 |
| 3 | Yemen | 45 | United States | 10 |
| 4 | Andorra | 44 | Palau | 12 |
| 5 | Bhutan | 44 | Kiribati | 13 |
| 6 | Bahrain | 44 | Mexico | 14 |
| 7 | Togo | 43 | China | 16 |
| 8 | Niger | 43 | Lebanon | 17 |
| 9 | Madagascar | 43 | Philippines | 17 |
| 10 | Monaco | 42 | Nigeria | 17 |
(Source: visualcapitalist.com)
Paid Holiday Statistics By Schedule
It is simpler to comprehend the typically paid holiday schedule once you know the average paid holiday stats. We discovered it as follows:
- The Federal paid holiday schedules to include Martin Luther King Jr.'s birthday, New Year's Day, Memorial Day, the President's birthday, Labor Day, Veterans Day, Indigenous Peoples Day, Christmas Day, and Thanksgiving Day, in that order.
- If you are not a federal worker, businesses' most expected holidays are Easter, Independence Day, New Year's Day, Thanksgiving Day, Labor Day, Memorial Day, Christmas Day, and the Friday after Thanksgiving Day, in that order.
(Source: Zippia.com)
Conclusion
The majority of businesses still give their employees paid holidays even though the federal government and the majority of states do not require paid holidays as a part of the law. American workers typically get 7.6 paid holidays per year; however, this number might change depending on the state, industry, as well as the number of years a person has been in a particular profession.
Overall, the United States lags behind several other nations regarding paid vacation opportunities. And this is not just because of the government or companies either. The majority of Americans decide not to take their paid vacation days.
Unquestionably, Americans are workaholics.
Sources
FAQ.
It is entirely up to your company how many days you are paid time and a half. Employers frequently decide to offer time and a half for federal holidays even if there is no requirement in state law to do so.
The following federal holidays are listed for reference: Martin Luther King Jr.'s Birthday, New Year's Day, Independence Day, Memorial Day, Labor Day, President's Birthday, Veterans Day, Indigenous Peoples Day, Christmas Day, and Thanksgiving Day.
"Paid holidays" are days on which employees are paid even when they are not working. These days are typically provided by employers to honor workers who celebrate state, national, and religious holidays.
Paid holidays are distinct from paid time off (PTO) in that PTO frequently refers to personal vacation days, whereas paid holidays denote days off from work that the entire organization shares.
Depending on your place of employment, there are 7.6 to 10 paid holidays each year. The federal government offers at least ten paid holidays yearly, while the average national number of paid holidays is 7.6. Additionally, some firms offer "floating" holidays, which let you take a paid holiday on a special occasion.
Manufacturing is the industry with the highest number of paid holidays, where 97% of workers have access to nine paid holidays annually on average. On the other hand, only 37% of employees in the Hospitality and Leisure sector get paid holidays.
Typically, businesses offer six paid holidays every year. Around 21% of firms offer six paid holidays annually, 14% of companies provide 10 days per year, and 13%, 12%, and 9% offer 7, 8, and 9 days per year, respectively.
20% of workers are fortunate enough to receive 11 or more paid holidays annually, while 11% of employees are unlucky enough to receive 5 or fewer paid holidays each year.
The nine major paid holidays are Martin Luther King, Jr.'s Birthday, New Year's Day, Memorial Day, Independence Day, Juneteenth, Labor Day, Thanksgiving Day, Veterans Day, and Christmas Day.
Among 9 holidays, 8 are recognized in the 50 states, and Juneteenth is recognized in each state except South Dakota. 41 states recognize President's day as the most popular paid holiday.
The average American employee receives approximately 10-11 paid holidays a year. In more detail, the average civilian employee gets 7.6-10 paid holidays, while six is the highest representation in the workforce.

Barry is a lover of everything technology. Figuring out how the software works and creating content to shed more light on the value it offers users is his favorite pastime. When not evaluating apps or programs, he's busy trying out new healthy recipes, doing yoga, meditating, or taking nature walks with his little one.
