Wedding Industry Statistics – By Traditions, Demographic, Places, Seasons or Time

Page Contents
Introduction
Wedding Industry Statistics: The wedding industry has become a billion-dollar industry as people started following the traditions. Rather than only moving in people are more likely to get married in the past few years. Moreover, digitalization offered more features to get to know the partner well before actually getting married. Indian wedding industry follows traditions more than any other country as compared to vows, families, and other things.
In this Wedding Industry statistics, we will have a look into some exciting general statistics further divided into traditions, demographic, places, by seasons or time, and much more informative stuff.
(Editor’s Choice)
- There are 80% of the couple prefer to spend on destination weddings.
- Gaza, Fiji, Egypt, and the West bank are the countries with the highest rate of marriages.
- The expected global bridal gown market as of the year 2022 was $43.5 billion.
- 65% of the couples are more likely to get married in the Summer and fall seasons.
- 1 of the 4 is a destination wedding.
- The average cost of a destination wedding is $225 per person.
- In the year 2022, 6.77 billion people are living in countries where same-sex marriage is not legal.
- As per the 2021 Wedding industry statistics, in the United States of America, there were 5,000 weddings held every day, resulting in 1,934,982 weddings in a year.
- On average, considering destination weddings, the hotel offers 22% off on group discounts.
- The global wedding industry is expected to increase to $291 billion by the year 2031.
Wedding Meaning And History
A wedding refers to the ceremony of uniting two people. Wedding traditions and customs differ from country to country based on religions, social classes, and religions. In the majority of countries, traditional western customers are followed during the marriage ceremony. During the wedding, the ring has a religious meaning followed in all the regions. There are various types of weddings such as destination weddings, civil weddings, white weddings, elopement, handfasting, double weddings, micro weddings, mass Scottish weddings, peasant, military, weekend, shotgun, vow renewals, and same-sex weddings.
General Wedding Industry Statistics
- As of 2022, the estimated matrimony market in India was $0.26 billion.
- Considering the Wedding Industry statistics, men fall in love faster than women with a percentage of 48% to 28%.
- Men remarry more than women.
- In the year 2021, on average families spend around $34,000 on their wedding along with the reception, engagement ring, and ceremony.
- Wedding Industry statistics say that families who are getting married hire around 14 wedding professionals to plan and execute the marriage.
- Couples who got engaged in the year 2021, had already set their marriage dates for the year 2022.
- 98% of the people who set the dates of marriage in the year 2022 were confident enough to complete the event as planned.
- The global wedding industry is expected to increase to $291 billion by the year 2031.
- Gaza, Fiji, Egypt, and the West bank are the countries with the highest rate of marriages.
- As stated by the Wedding Industry statistics Peru, French Guiana, and Qatar are the lowest rate of marriage countries.
- In the United States of America, the total number of the expected wedding was 2.6 million.
- As per the 2021 Wedding industry statistics, in the United States of America, there were 5,000 weddings held every day, resulting in 1,934,982 weddings in a year.
- As of 2022, the average cost of marriage in the united States of America was $27,100.
- 72% of the bridges wish they had spent more time choosing their budget entertainment.
- The expected global bridal gown market as of the year 2022 was $43.5 billion.
- Wedding industry statistics show that the revenue of the wedding market reached $57.9 billion in the year 2022.
- The United States of America accounts for 25% of all weddings around the world.
- 50% of the engaged people in the UK said spending in the budget was the biggest challenge for marriage as of 2021.
- Newly married couples in the year 2022 invited around 43 people on average during marriage and engagement events.
- 1 of the 4 is a destination wedding.
- According to the Wedding industry statistics, 50% of weddings are planned using wedding planners.
- On average, considering destination weddings, the hotel offers 22% off on group discounts.
- On average a traditional wedding has 141 guests and 86 guests for a destination wedding.
- As per the Wedding industry statistics, a destination wedding is a leading option for second marriages.
- As of 2022, 59% of the male population did not get married because of financial concerns.
- The global Wedding industry statistics reported a $21.43 billion global market in the year 2022.
- Couples who spend less than $10,000 on the wedding, are less likely to have any divorce.
- 1 out of every 1,000 people is married.
- 2 out of 3 millennials start planning their marriage before getting engaged.
- 44% of the couples write their own vows.
- 22% set up an inspirational wedding theme.
- Around 60% of couples marry partners with different backgrounds.
- 35% of the couples owned a pet before getting married.
By Seasons And Time
- 65% of the couples are more likely to get married in the Summer and fall seasons.
- 17th October was the busiest date for being married around the world as of 2022.
- Similarly, December 2022 was recorded as the most popular month to get engaged.
- Couples spend around 2 hours every week planning the wedding.
By Places
- The most popular wedding destinations in the USA are California, Nevada, and Florida.
- There are 80% of the couple prefer to spend on destination weddings.
- Other than the USA, Hawaii, the Caribbean, and Mexico are famous destination wedding places.
- As of 2022, around 50% of marriages took place within international boundaries.
- The average budget for a destination wedding for a bridal is $35,000.
- Las Vegas is the leading venue for conducting 1,00,000 marriages every year.
- The average cost of a destination wedding is $225 per person.
- 9 out of 10 people believe that selecting the weather condition and a destination is the key factor in a wedding.
- 20% prefer to get married in hotels, while 13% prefer barns.
- 33% of the people choose religious institutions for the wedding and 5% of people get married in the local register office.
- 3% of couples marry in castles.
By Digitalization
- 21% of the people don’t update their status as married or engaged after the event.
- Las Vegas is the popular honeymoon check-in as per Facebook.
- 53% of people love to create wedding hashtags.
- 35% of the people update their wedding status within 24 hours on social media networks.
- 64% of the people take ideas from Pinterest for the wedding.
By Expenses
- The overall marriage expenses are around $1,000 to $3,000 excluding the honeymoon.
- As of 2022, 56% of the residents in Germany spent around euro 1,000 to euro 4,000 on wedding dresses.
- The average cost of a wedding in Spain is around euro 20,000 as of 2022.
 (Reference: Statista)
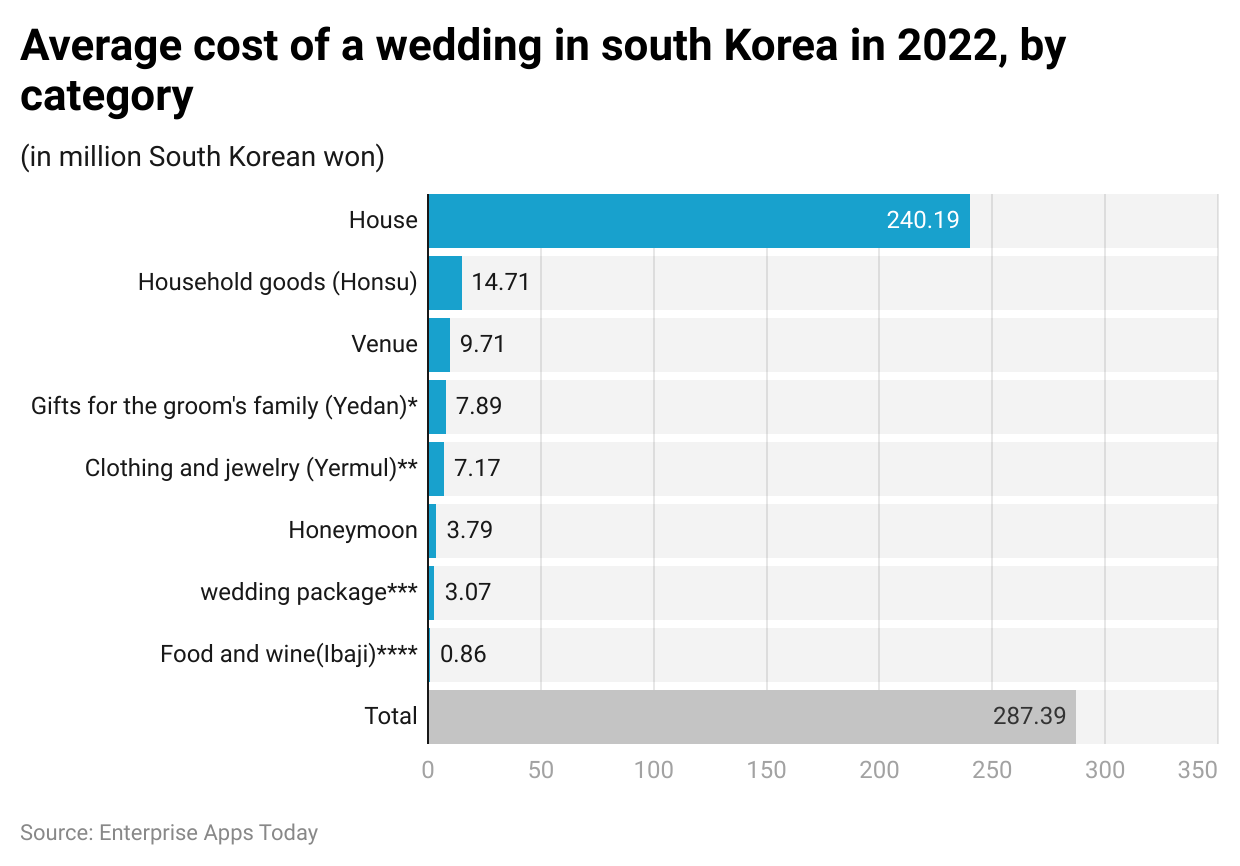
- As per the Wedding industry statistics, in 2022 the average cost of weddings in South Korea is reported 287.39 million (south Korean won).
- People spent around 240.19 million on housing investments during their weddings.
- 71 million people spent on household goods in 2022.
- While 9.71 million people spent on the wedding venue.
- The groom’s side spending on gifts expenses and clothing and jewelry accounted for 7.89 million and 7.17 million respectively.
- Spending on honeymoon and wedding packages was 3.79 million and 3.07 million each.
- The remaining 0.86 million were reported to have been spent on food and wine.
 (Reference: Statista)
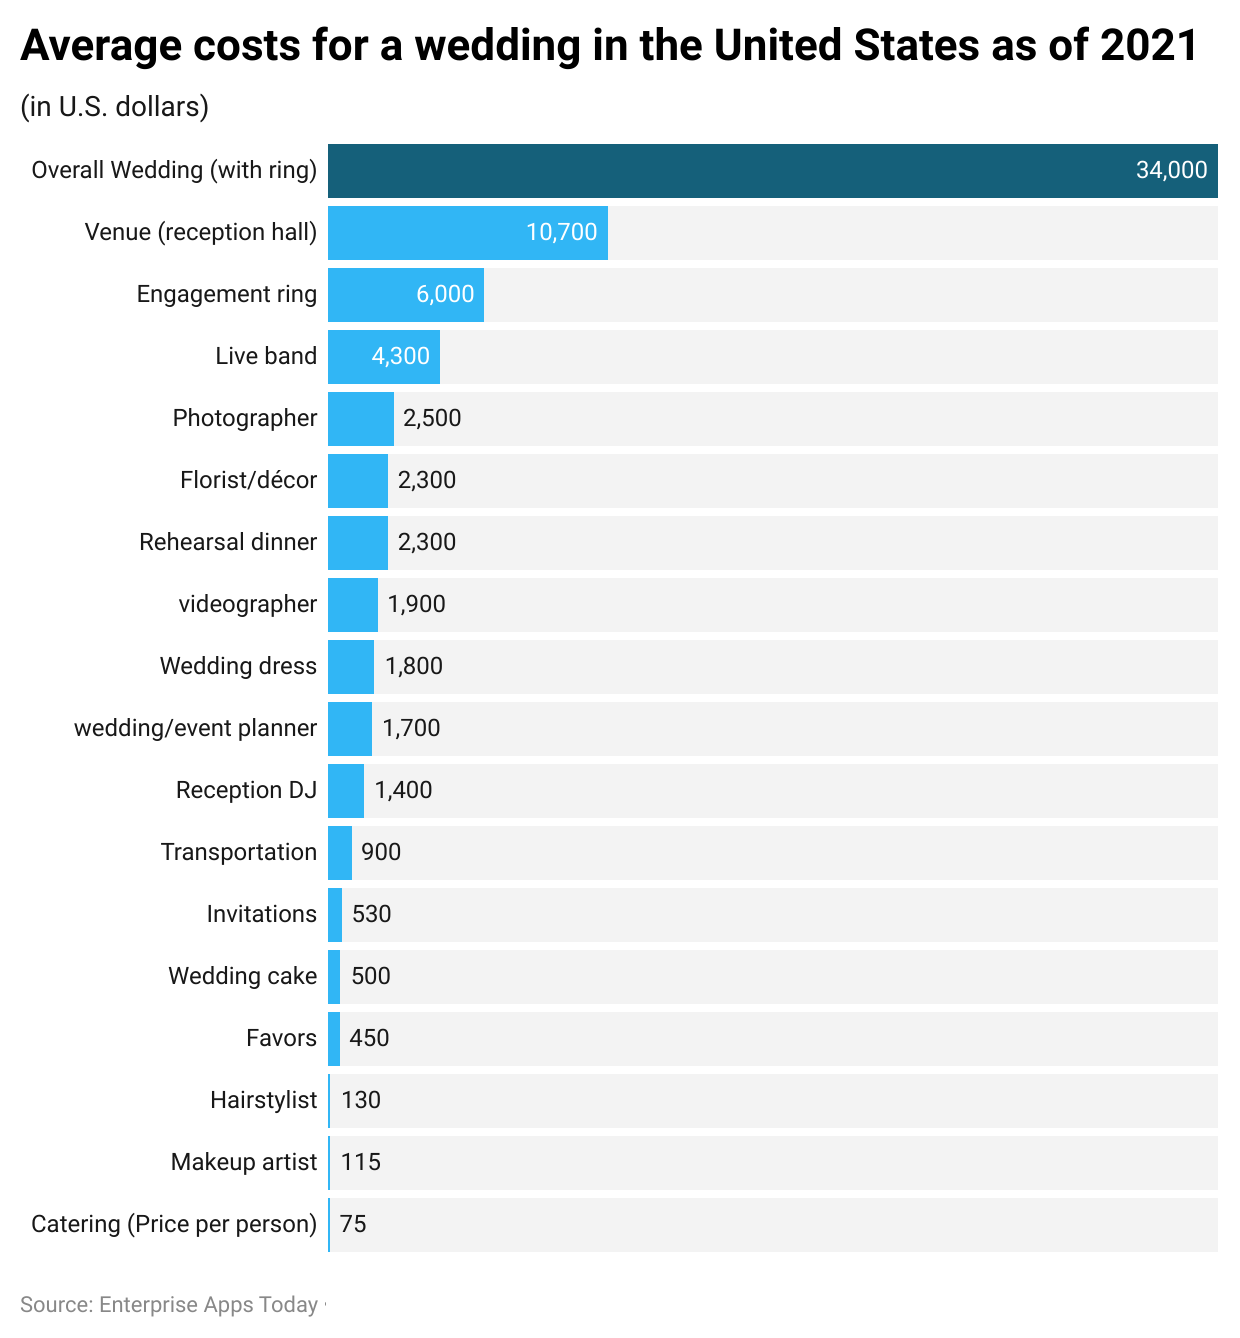
- As per the Wedding industry statistics as of 2021, the overall wedding expenses are $34,000 including the ring.
- These expenses are further divided into venues resulting in $10,700.
- An engagement ring costs around $6,000 whereas music entertainment such as a live band costs around $4,300.
- Other wedding expenses such as photographer, florist/décor videographer cost around 2.500,2.300, and 1.90 respectively.
- Whereas rehearsal dinner costs around 2,300.
- Other miscellaneous expenses in the United States of America resulting as of the year 2021 are Wedding dresses ($1,800), Wedding planner ($1,700), Reception DJ ($1,400), Transportation ($900), Invitations ($530), Wedding cake ($500), Favours ($450), Hairstylist ($130), Makeup artist ($115) and Catering per person ($75).
By Tradition
- 3% of the brides sign a prenuptial agreement.
- Only 80% of brides change their names after marriage.
- 77% of the fathers escort the groom or bride down the aisle.
- 67% of the couples ask for their parent’s blessing before proposing.
- 72% of the couples live together before getting married.
By Region
Europe
- The leading wedding destination in Europe is Tuscany and Campania.
- The total number of marriages held in 2021 in France is 220K.
Latin America
- Latin America and the Caribbean are the countries where same-sex marriage is allowed resulting in 18%.
By Demographics
- The average age in the United States of America is 27.8 for women and 29.8 for men.
- 27 years is the average age for millennials to get married.
- 70% of the degree holders with an income of $1,10,000 a year have destination weddings.
(Reference: Zippia)
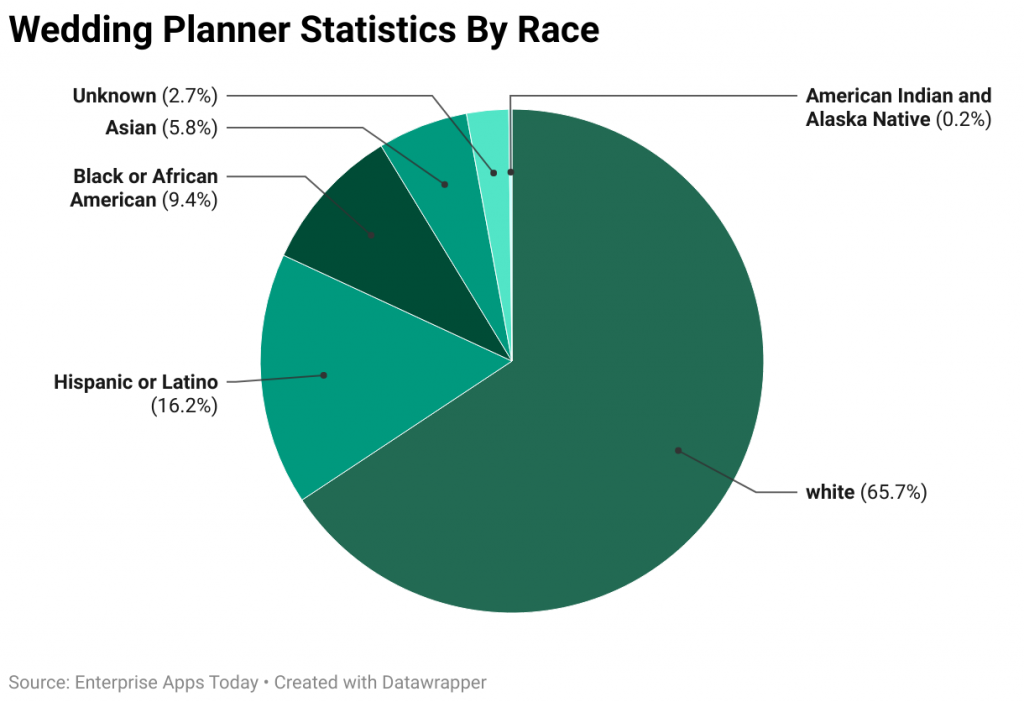
- Around the world, there is 65.7% white population are wedding planners.
- 2% of Hispanic or Latinos are also wedding planners.
- While African American or black population contributes around 9.4%
- There are 5.8% of Asian wedding planners as stated by Wedding industry statistics.
- Moreover, Alaska natives and American Indians are around 0.2% while the remaining 2.7% haven’t shared any information on their ethnic background.
By Average age
- In the Southwest and west people get married at the age of 32 females and 33 for males and 33 for females and 34 for males respectively. In both regions, on average the age of both is 32 and 33 years each.
- Midwest has an average age of 31 for females and 33 for males. The couple’s average age is 32 years.
- South and southeast get married on average age of 33 years with a female at 33 years and a male at 34 years.
- Northeast has females and males getting married at the age of 33 years and 34 years respectively.
- Considering the Mid-Atlantic, the average age of couples is 33 years where 34 years is for males and 33 years for females.
By Education Background
(Reference: Zippia)
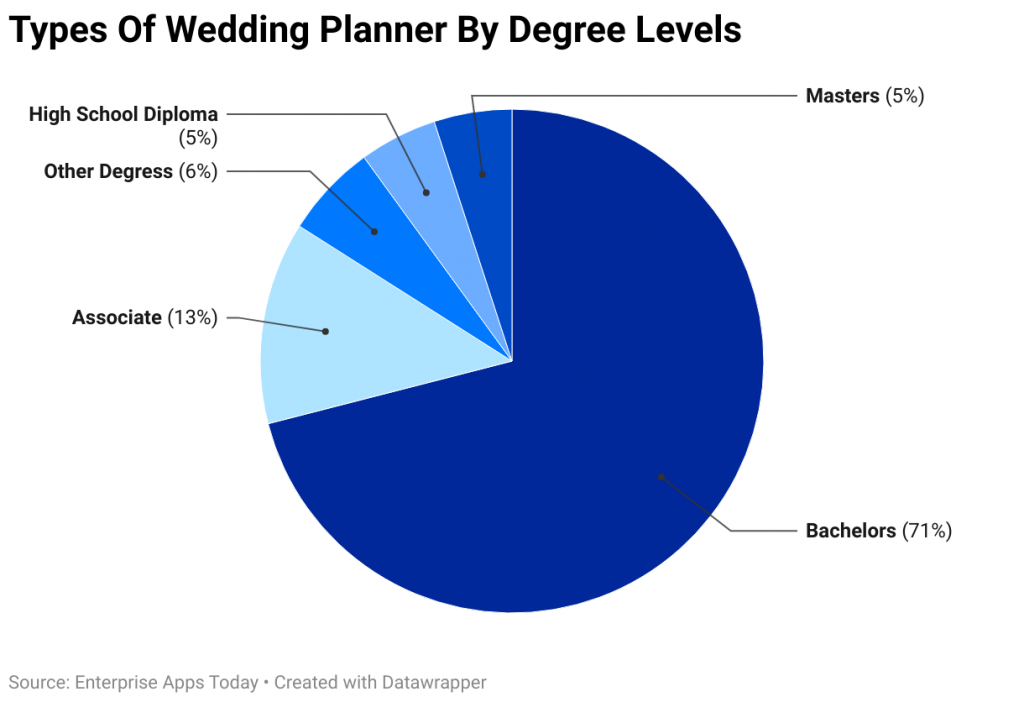
- According to Wedding industry statistics, people who are wedding planners have a bachelor’s degree resulting in 71%.
- 13% of the people have an associate degree and 5% have a high school diploma.
- While others 5% have master’s degrees and 6% have other degrees around the globe.
By Choice
(Reference: Our World in Data)
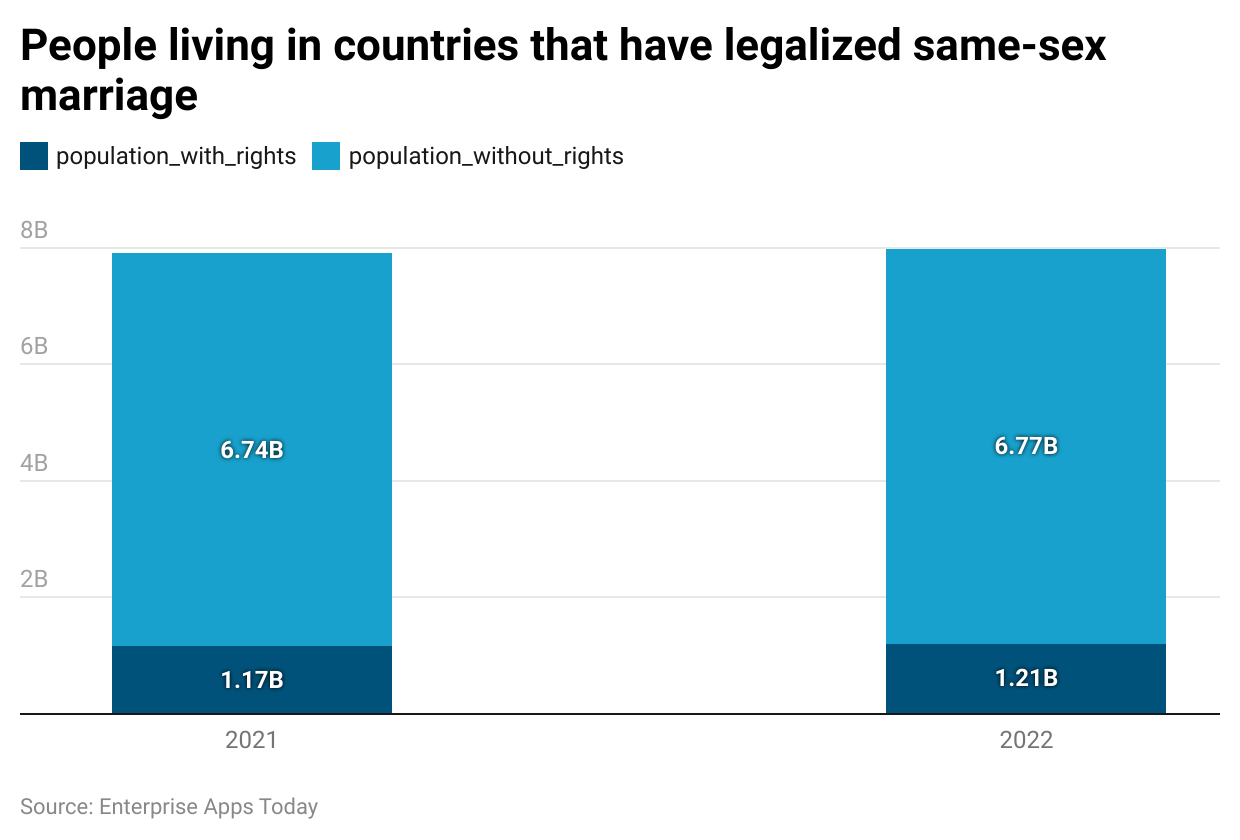
- There are around 1.21 billion people living in countries where same-sex marriage is legal as of 2022.
- On the other hand, in the year 2022, 6.77 billion people are living in countries where same-sex marriage is not legal.
- Similarly in the year 2021, 1.17 billion people lived in countries where same-sex marriage was legal, and 6.74 billion people were in countries where same-sex marriage was not legal.
Conclusion
The global wedding industry is increasing day by day because people are understanding the meaning of weddings rather than any other meaningless relations. Just like any other industry, the Wedding industry has also become a billion-dollar industry. India mainly focuses on arranged marriages due to its customs while international with open cultures are more likely to do love marriages.
Considering the wedding industry during the lockdown, it has grown in a more progressive way than ever before. Due to technology, people are able to meet their future families who are staying within international boundaries. The pandemic period even experienced digital marriages over Zoom video calls being unique of all.
Sources
FAQ.
Yes, you can become a wedding planner, but it is better to have an event management certification done.
The word Wedding comes from the old English ‘Weddung’ an alternative word for bride lope (literally meaning bridal run). Wed refers to pledging oneself which refers to both parties.
The marriage certificate is the legal proof of the wedding.
For girls to get married the legal age is 18 years and for boys, it is 21 years. These rules may change according to the country.

Barry is a lover of everything technology. Figuring out how the software works and creating content to shed more light on the value it offers users is his favorite pastime. When not evaluating apps or programs, he's busy trying out new healthy recipes, doing yoga, meditating, or taking nature walks with his little one.


