Wendy’s Statistics – By Product, Website Traffic, Demographics, Market Share, Display Boards, Brand Profile, Locations, State, Employment
Page Contents
- Introduction
- Editor’s Choice
- Who is Wendy’s?
- What Do They Have On Their Menus?
- General Wendy’s Statistics
- Wendy’s Statistics by Product
- Wendy’s Statistics By Drive-thrus Rating
- Wendy’s Statistics By Website Traffic
- Wendy’s Statistics By the Source of Website Traffic
- Wendy’s Statistics by Demographics
- Wendy’s Statistics By Market Share
- Wendy’s Statistics By The Display Boards
- Wendy’s Statistics Speed of Service
- Wendy’s Statistics By Brand Profile
- Leading Restaurant Chains By Brand Awareness
- Wendy’s Statistics By Order Accuracy Including Special Request
- Wendy’s Statistics By Locations
- Wendy’s Statistics By Total Time By Cars In Drive-thrus in Line
- Wendy’s Statistics By Website Traffic By Device
- Wendy’s Statistics By State
- Wendy’s Statistics By Employment
- Conclusion
Introduction
Wendy’s Statistics: Hamburgers, Croissants, and Coffees are the most mouth-watering food items ever made on the planet (Of course this is our opinion)! Wendy’s is one of the most visited fast food and quick service restaurants. Although Wendy’s has a long way to go in the total market, every year they are entering new markets globally.
Scroll down to these mouth-watering Wendy’s Statistics, our team has already ordered a bunch of Hamburgers and Croissants.
Editor’s Choice
- As of 2022, Wendy’s average sales generated around $2.19 million from company-owned restaurants as stated by Wendy’s Statistics.
- Wendy’s Statistics state that, every day the locations are visited by 32,876 loyal customers.
- In 2022, 57.6% of the customers of Wendy’s said that the drive-thrus service of this quick-service restaurant is friendly.
- McDonald’s, Wendy’s, and Hardee’s showed pre-sell menu boards in place as stated by 86.30%, 66.40%, and 64% of customers respectively.
- The international franchised stores generated average sales of around $1.53 million.
- As of 2023, Wendy’s ranked second in the largest quick-service restaurant in the hamburger sandwich segment.
- Considering the people who order online through wendys.com, consumers aged between 25 to 34 years contribute the highest resulting in 26.35%.
- The total number of Wendy’s restaurants in the United States of America as of 2022 is 5,994. Out of these 403 stores were owned by the company.
- The hamburger sold by Wendy’s is the lowest-calorie burger.
Who is Wendy’s?
Wendy’s is an American-based international fast-food restaurant chain as well as a quick-service restaurant brand. This fast-food restaurant was founded in 1969 and has its headquarters in the United States of America. Wendy’s offers a drive-thru service and also has an online food delivery service which can be ordered on Wendys.com. Various products sold at this quick service restaurant are Salads, French Fries, Frozen desserts, Hamburgers, Chicken sandwiches, and Breakfast sandwiches.
What Do They Have On Their Menus?

(Source: order.wendys.com)
General Wendy’s Statistics
- Wendy’s Statistics state that, every day the locations are visited by 32,876 loyal customers.
- Wendy’s is spread across 30 countries and planning to land new locations every year in new areas.
- As of 2022, there are 6,680 Wendy’s franchised restaurants around the globe.
- Similarly, the total number of Wendy’s restaurants in the United States of America as of 2022 is 5,994. Out of these 403 stores were owned by the company.
- Wendy’s global revenue as of 2022 is 2.1 billion.
- As of 2022, Wendy’s average sales generated around $2.19 million from company-owned restaurants as stated by Wendy’s Statistics.
- Similarly, the international franchised stores generated average sales of around $1.53 million.
- In 2022, the primary investment for the franchise of Wendy’s restaurants was projected at $3,693,000 including payments for building, improvements, equipment, signage, and land.
- According to Wendy’s Statistics, wendys.com received a total global traffic of 8.2 million in February 2023, while it was 7.9 million in January 2023. This has shown a 2.7% increase in the total website traffic in February 2023.
- com has 84.24% organic traffic and 15.76% of paid traffic.
- Wendy’s was the first-ever fast-food chain to land a value menu by launching the entire menu at 99 cents.
- Moreover, Wendy’s is the first-ever fast-food chain restaurant to introduce a salad bar.
Wendy’s Statistics by Product
- The hamburger sold by Wendy’s is the lowest-calorie burger.
- Moreover, Big Bacon Cheddar Triple contains the highest-ever calories resulting in only 82g Protein, 1,420 calories,46g Carbs, and 102g Fat.
- As of 2021, French Fries ranked as the top-selling items at Wendy’s.
- As of 2023, Wendy’s ranked second in the largest quick-service restaurant in the hamburger sandwich segment.
- Every year, around 300 million Chocolate Frosty are sold globally.
- Wendy’s name is coined after the founder’s fourth daughter.
Wendy’s Statistics By Drive-thrus Rating
(Reference: statista.com)
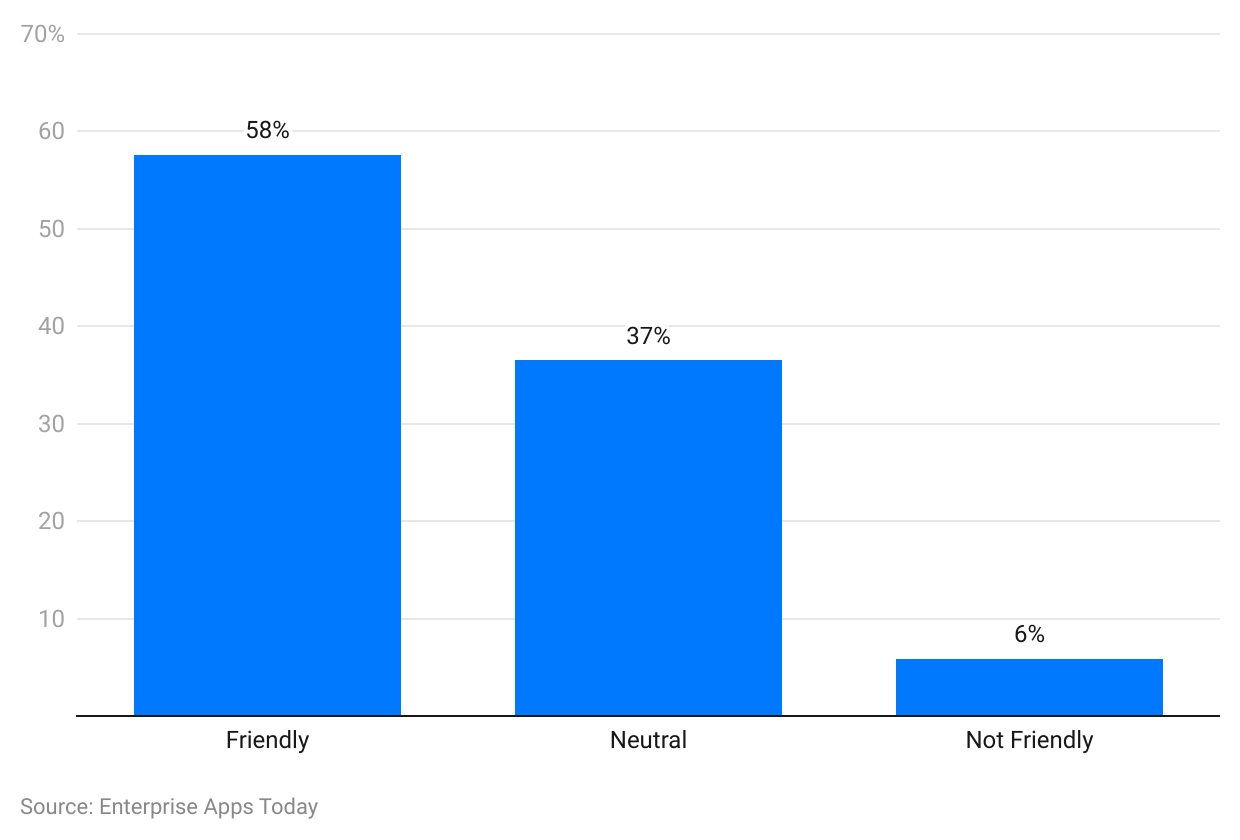
- As of 2022, 57.6% of the customers of Wendy’s said that the drive-thrus service of this quick-service restaurant is friendly.
- 5% of the customers said it was neutral.
- On the other hand, 5.9% of the fast-food consumers at Wendy’s did not agree with any of the positive reviews marking it as not friendly.
Wendy’s Statistics By Website Traffic
- Considering the social media network traffic, YouTube has the highest rate of referral at 45.86%.
- Facebook sends overall traffic by 18.30% while Reddit has a referral rate of 11%.
- Moreover, 9.86% of traffic is sent by Twitter, and other social media apps collectively make up 2.87% of the total website traffic reference rate.
Wendy’s Statistics By the Source of Website Traffic
- The highest number of traffic received on Wendys.com is through organic search, while 28.32% is direct traffic.
- 29% is sent by referral traffic, and 10.39% is paid search traffic.
- Moreover, only 0.35%, 0.22%, and 0.90% are sourced from social media networks, mail advertising, and display advertising.
Wendy’s Statistics by Demographics
By Age Group
(Reference: similarweb.com)
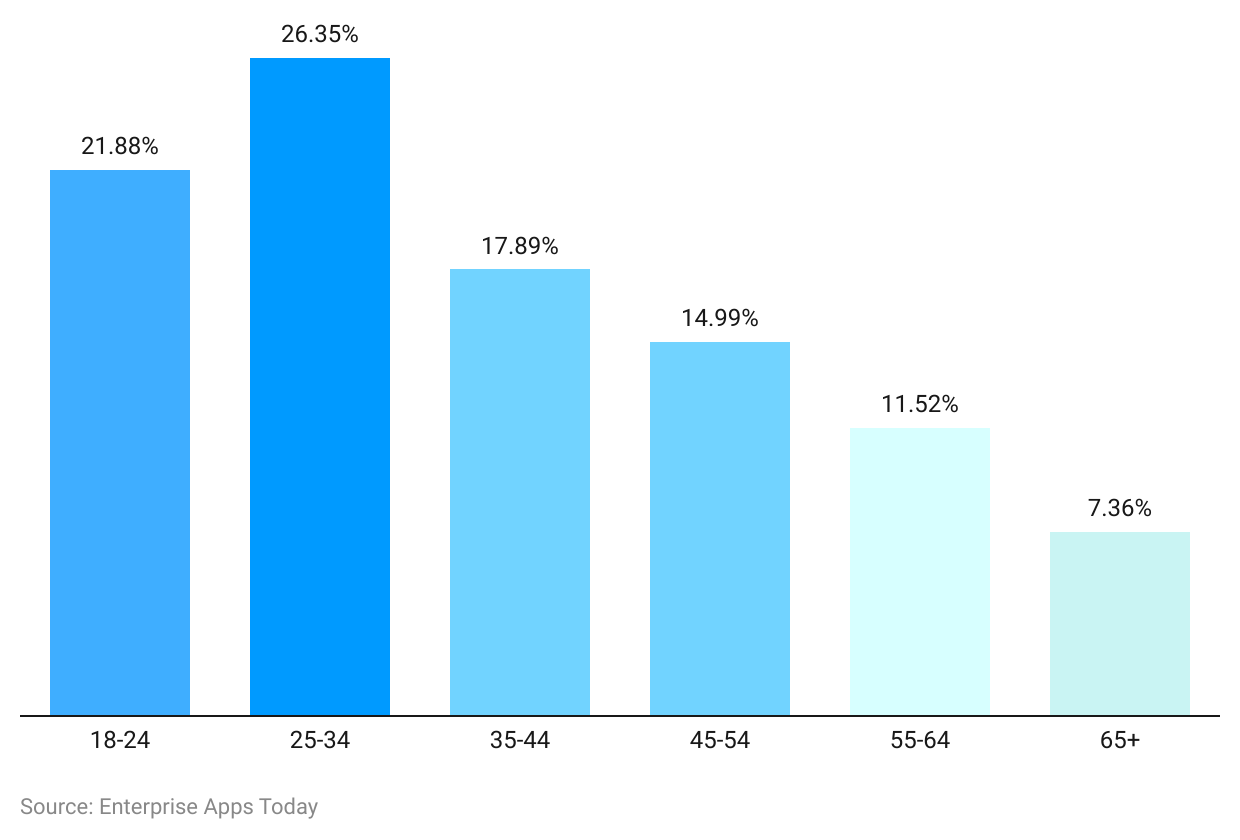
- Considering the people who order online through wendys.com, consumers aged between 25 to 34 years contribute the highest resulting in 26.35%.
- There are 21.88% of customers aged 18 to 24 years.
- 89% and 14.99% of fast-food consumers of Wendy’s belong 35 to 44 years and 45 to 54 years respectively.
- Moreover, there are 11.52% of customers aged between 55 to 64 years whereas 7.36% of customers are 65 years and above.
- Around 43.97% of the consumers are female and 56.03% are male consumers.
| Fast Food Company | Market Share |
|---|---|
| McDonald's | 21.4% |
| Starbucks | 7.5% |
| KFC | 2.8% |
| Wendy's | 2.5% |
| Burger King | 1.2% |
(Source: zippia.com)
- As of 2022, in the United States of America, McDonald’s has the largest captured market share resulting in 21.4%.
- Further, it is followed by Starbucks and KFC at 7.5% and 2.8% respectively.
- Wendy’s Statistics state that, this fast-food chain restaurant has a long way to go as it has only 2.5% of captured market share in the United States of America.
- On the other hand, Burger King has only 1.2% of the total market share.
Wendy’s Statistics By The Display Boards
By Digital Menu Boards and Order Confirmation Board
(Reference: qsrmagazine.com)
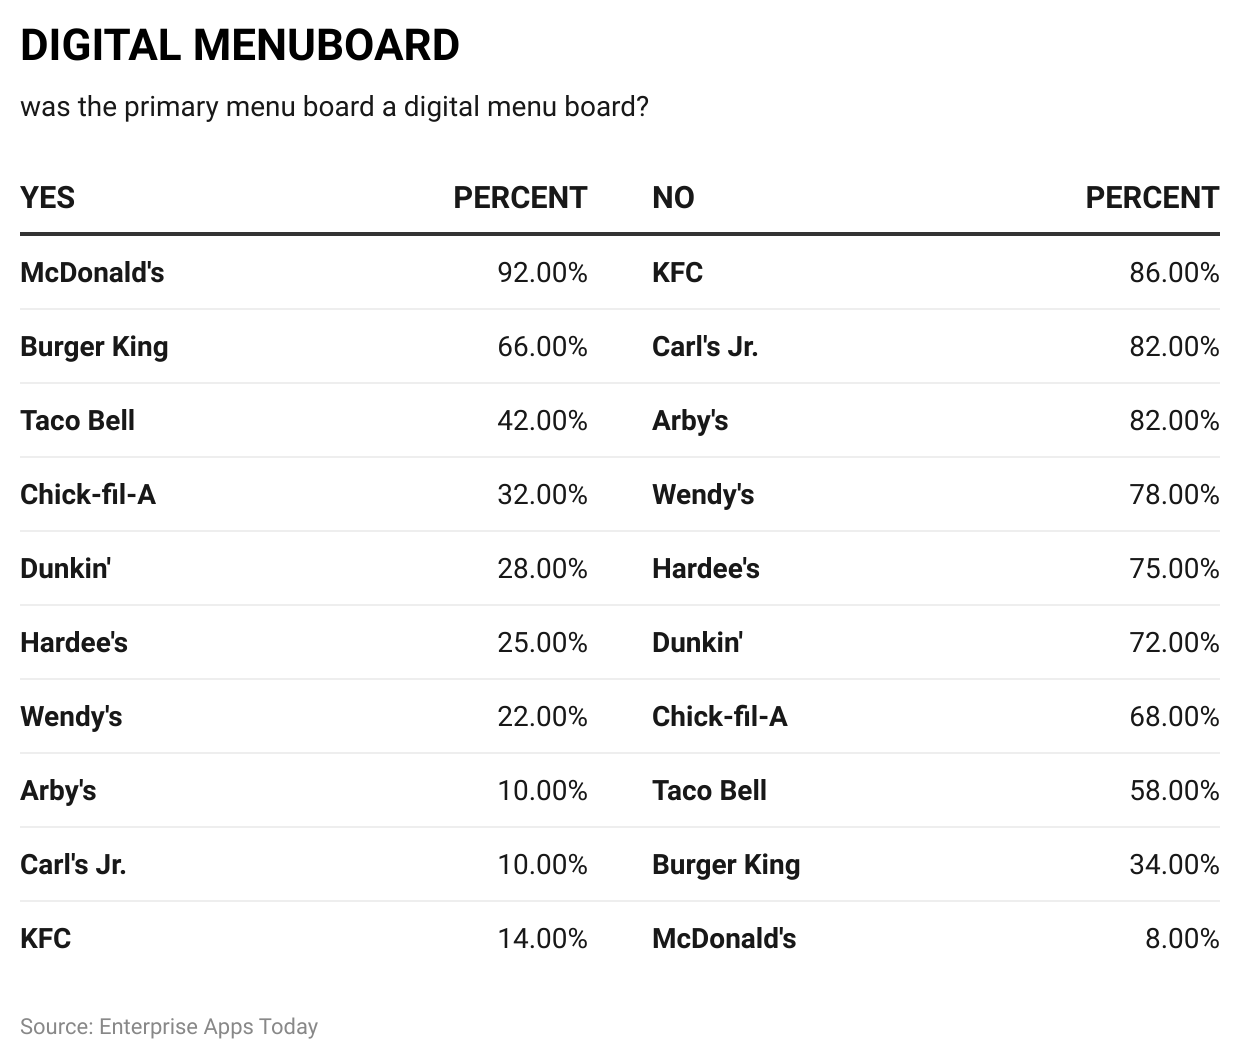
As of 2022, according to the QSR report of Quick Service restaurants analysis, the top three fast food chains that showed a primary digital menu board while drive-thrus were McDonald’s (92%), Burger King (66%), and Taco Bell (42%). Wendy’s has only 22% of voters in the similar category. On the other hand, 78% of the consumers of drive-thru state that the primary menu board wasn’t a digital menu board.
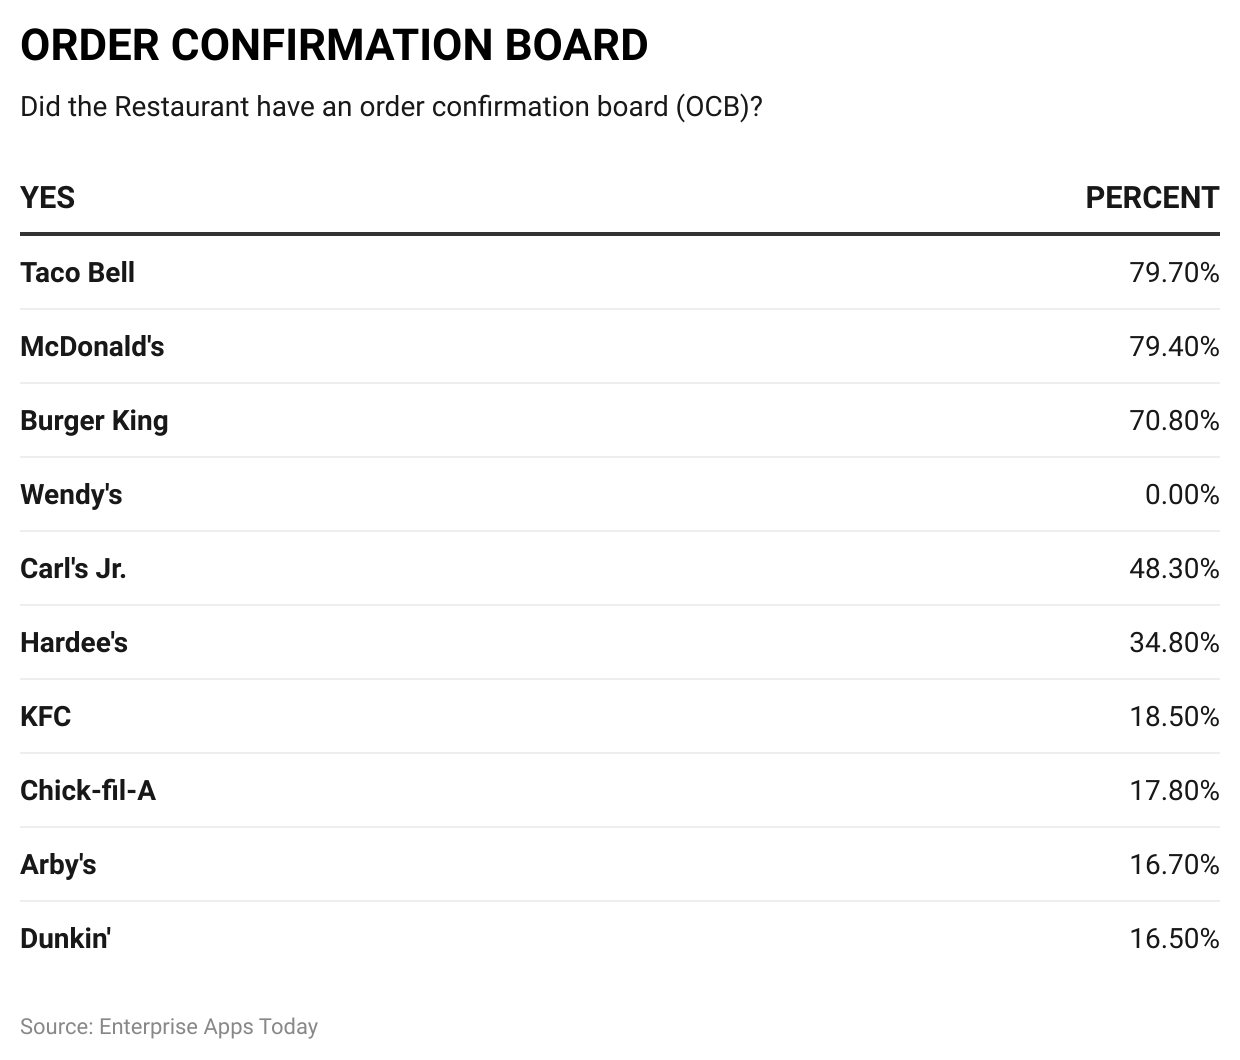
Furthermore, Wendy’s received 70% of the score for showing an order confirmation board.
By Pre-sell Menu Board and Suggestive Sell Menu Board
(Reference: qsrmagazine.com)
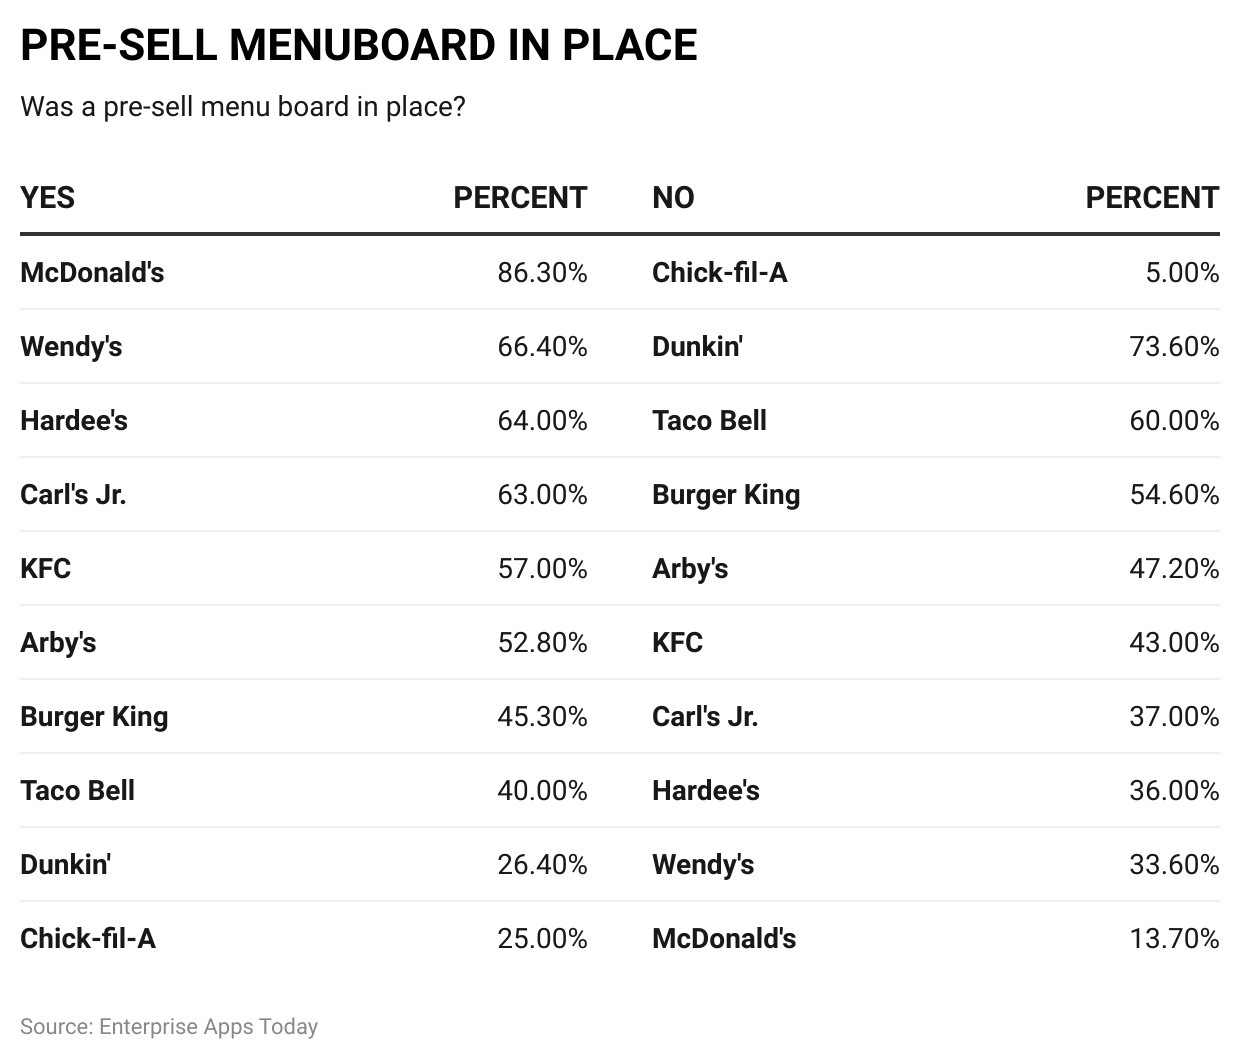
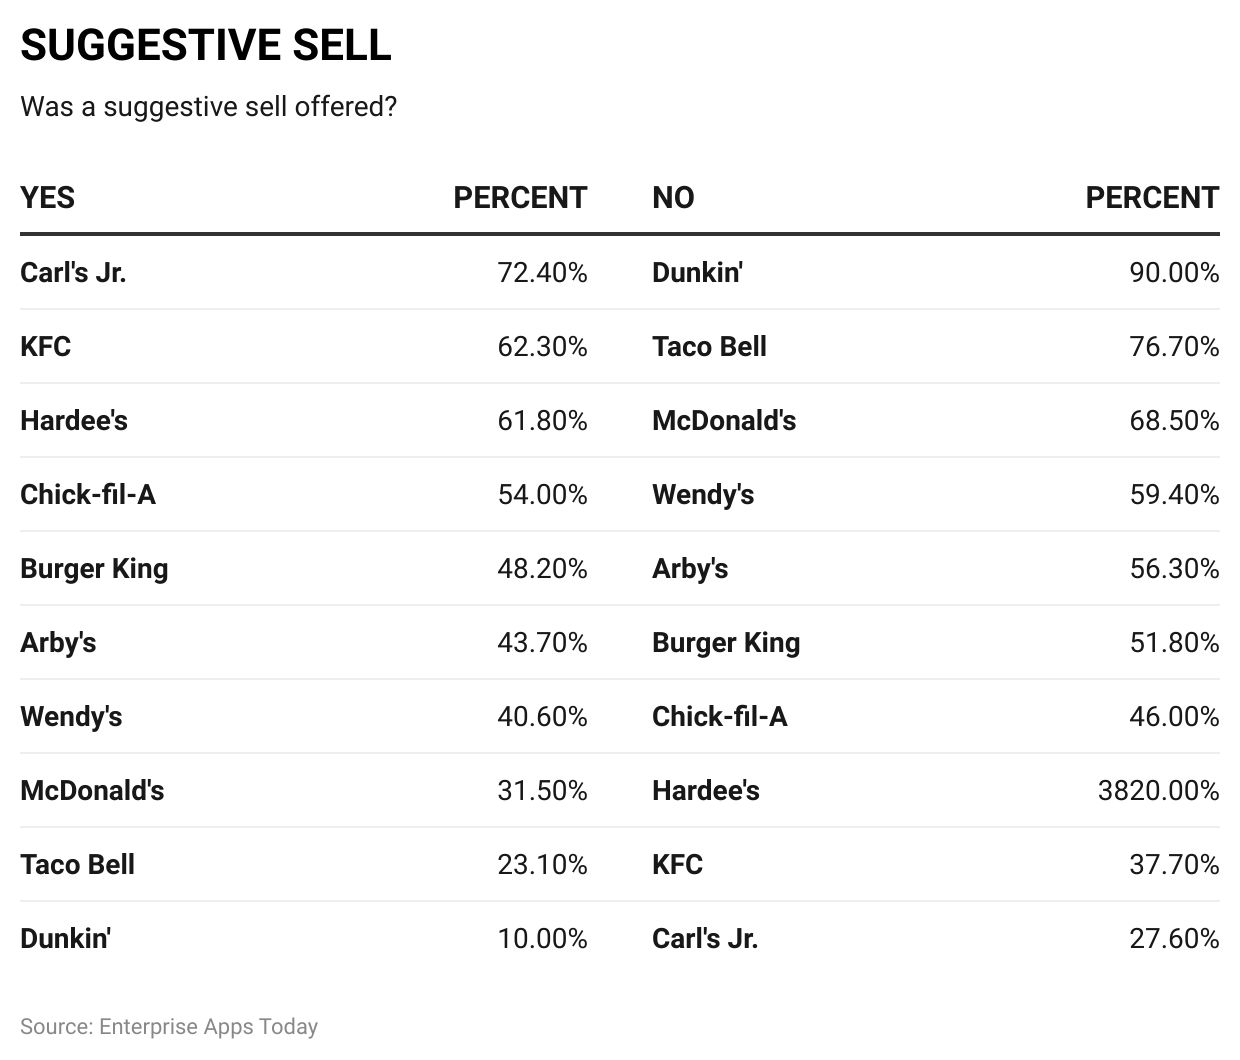
Moreover, McDonald’s, Wendy’s, and Hardee’s showed pre-sell menu boards in place as stated by 86.30%, 66.40%, and 64% of customers respectively. On the Other hand, 33.60% of Wendy’s customers did not see any pre-sell menu board during drive-thrus.
On the other hand, 40.60% of the customers said they received a suggestive sale while 59.40% did not receive it.
Wendy’s Statistics Speed of Service
Speed of Service
| Average Service Time (SECONDS) | |
|---|---|
| Taco Bell | 221.99 |
| Dunkin' | 238.16 |
| KFC | 239.02 |
| Arby's | 261.19 |
| Burger King | 266.68 |
| Hardee's | 272.10 |
| Wendy's | 275.84 |
| Carl's Jr. | 289.36 |
| McDonald's | 291.30 |
| Chick-fil-A | 325.47 |
(Source: qsrmagazine.com)
- According to QSR Reports of 2022, the top three in the fastest speed of service in drive-thrus are offered by Taco Bell (221.99 average seconds), Dunkin’ (238.16 average seconds), and KFC (239.02 average seconds).
- According to Wendy’s Statistics, Wendy’s secured 7th place by having an average service time of 275.84 seconds.
- The lowest average speed of service was Carl’s Jr (289.36), McDonald’s (291.30), and Chick-fil-A (325.47).
Wendy’s Statistics By Brand Profile
- 47% of the customers in the United States of America said they like the brand as of 2022.
- Out of 94% of the brand awareness, 47% of these people are regular customers of Wendy’s.
- Moreover, Wendy’s Statistics state that, 37% of the customers are more likely to visit this fast-food chain restaurant again.
- As of 2022, 22% of the customers in the United States of America already heard about it on social media.
Leading Restaurant Chains By Brand Awareness
(Reference: Statista.com)
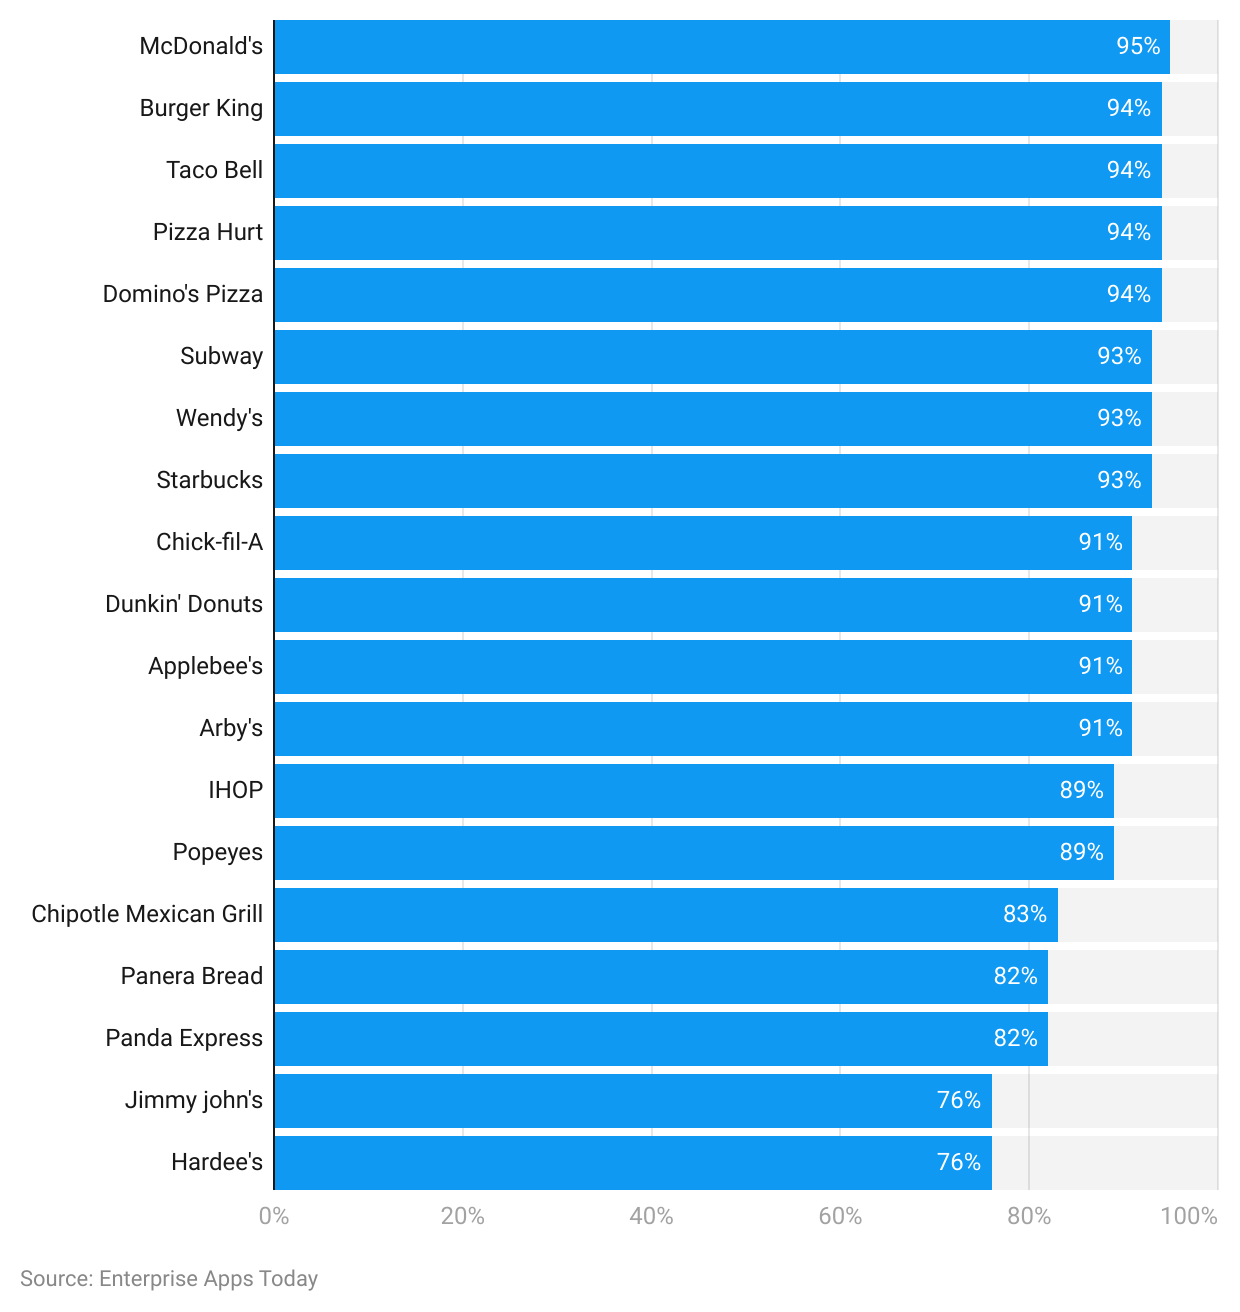
- Wendy’s Statistics by brand awareness in the United States of America in 2022 state, it has secured 8th place by having 93% of brand awareness along with Domino’s Pizza and Subway.
- Additionally ranked fast food restaurants in the list in 2022 are McDonald’s (95%), KFC, Burger King, Taco Bell, Pizza Hut (94%), Starbucks, Chick-fil-A, Dunkin’ Donuts, and Applebee’s (91%), Arby’s (90%), IHOP and Popeyes (89%), Chipotle Mexican Grill (83%), Panera Bread and Panda Express (82%), Jimmy John’s and Hardee’s (76%).
Wendy’s Statistics By Order Accuracy Including Special Request
| PERCENT | |
|---|---|
| Arby's | 89.60% |
| McDonald's | 89.00% |
| Burger King | 89.60% |
| Carl's Jr. | 86.20 |
| Hardee's | 85.40% |
| Taco Bell | 83.80% |
| Chick-fil-A | 83.00% |
| KFC | 82.60% |
| Dunkin' | 81.80% |
| Wendy's | 79.40% |
(Source: qsrmagazine.com)
- Wendy’s has ranked last for having order accuracy including special requests resulting in 79.40%.
- On the Other hand, Arby’s (89.60%), McDonald's (89%), and Burger King (86.90%) ranked top for having the highest score for order accuracy along with the special request in 2022.
- Other brands ranked in a similar category are Carl’s Jr (86.20%), Hardee’s (85.40%), Taco Bell (83.80%), Chick-fil-A (83%), KFC (82.60%), and Dunkin’ (81.80%).
Wendy’s Statistics By Locations
By Comparison
| Fast Food Company | Number of Locations |
|---|---|
| McDonald's | 38,700 |
| Subway | 36,800 |
| Starbuck | 33,800 |
| KFC | 24,100 |
| Pizza Hut | 18,700 |
| Burger King | 17,800 |
| Domino's | 17,000 |
| Dunkin' Donuts | 12,900 |
| Hunt Brothers Pizza | 8,000 |
| Baskin-Robbins | 7,700 |
| Wendy's | 7,100 |
(Source: zippia.com)
- Compared to other Fast food restaurant locations, Wendy’s has the lowest number of locations in the United States of America resulting in 7,100.
- Other Fast Food Chains have the following number of locations spread across the USA; McDonald’s (38,700), Subway (36,800), Starbucks (33,800), KFC (24,100), Pizza Hut (18,700), Burger King (17,800), Domino’s (17,000), Dunkin’ Donuts (12,900), Hunt Brothers Pizza (8,000), and Baskin-Robbins (7,100).
Wendy’s Statistics By Total Time By Cars In Drive-thrus in Line
#1. Chick-fil-A: 107.41 (seconds)
#2. McDonald's: 118
#3. Taco Bell: 127.58
#4. Arby's: 139.92
#5. Dunkin': 140.21
#6. Wendy's: 141.67
#7. Burger King: 147.43
#8. KFC: 142.84
#9. Hardee's: 180.21
#10. Carl's Jr.: 193.6
(Source: qsrmagazine.com)
- The total time by cars in the drive-thru line is explained in seconds, where Chick-fil-A ranks top as serving the ordered items as soon as possible in 107.41 seconds.
- Further followed by McDonald’s and Taco Bell at 118 and 127.58 seconds.
- Additional quick service restaurant brands in the list are Arby’s (139.92 seconds), Dunkin’ (140.21 seconds), Burger King (147.43 seconds), KFC (142.84 seconds), Hardee’s (180.21 seconds), and Carl’s Jr (193.6 seconds).
- Wendy’s serves in approximately 141.67 seconds.
Wendy’s Statistics By Website Traffic By Device
(Reference: semrush.com)
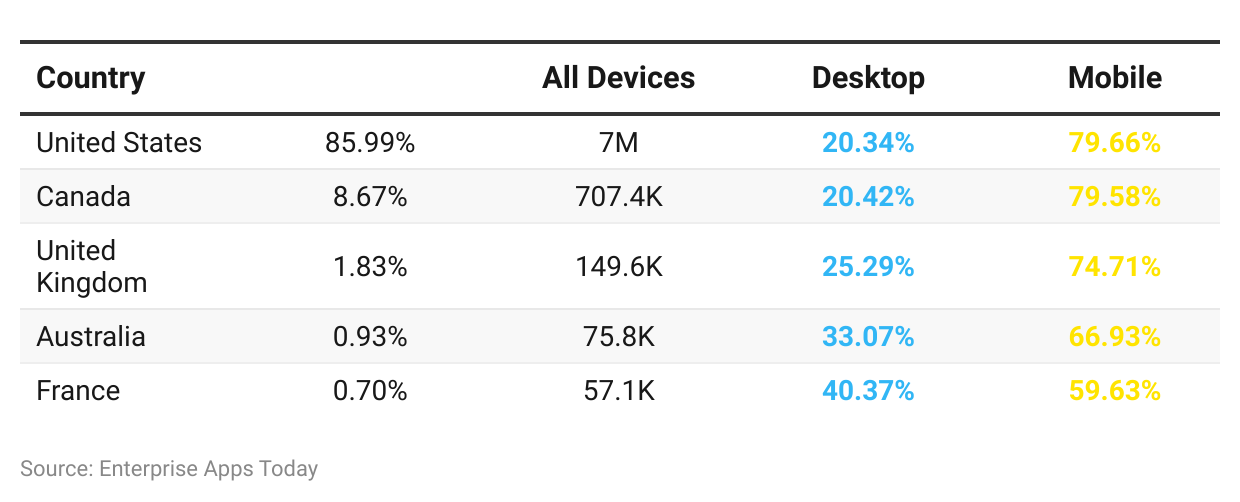
- In the past 6 months, 7 million total devices were used 85.99% of the traffic on Wendys.com was generated in the United States of America. Out of these, 20.34% of the consumers accessed it on desktops and 79.66% of the users accessed it on mobile phones.
- In Canada and the United Kingdom, the overall last 6 months generated traffic was 707.4K and 149.6K respectively resulting in 8.67% and 1.83% of overall traffic.
- In Canada, there are 20.42% of desktop users and 79.58% are mobile users. Whereas 25.29% of mobile users and 74.71% of mobile users belong to the United Kingdom.
- Australia generated 0.93% of total traffic whereas France was one of the top 5 countries to rank with 0.7% of total traffic in the last 6 months.
- Australia contributed by 75.8K devices out of these 33.07% were desktops and 66.93% were mobile phones.
- And France had 57.1K of overall devices, out of which 40.37% were desktops and 59.63% were mobile phones.
- Around nearly 2 million desktop devices and around 7 million mobile traffic was observed over the last 6 months resulting in 21.4% and 78.6% respectively.
Wendy’s Statistics By State
(Source: worldpopulationreview.com)
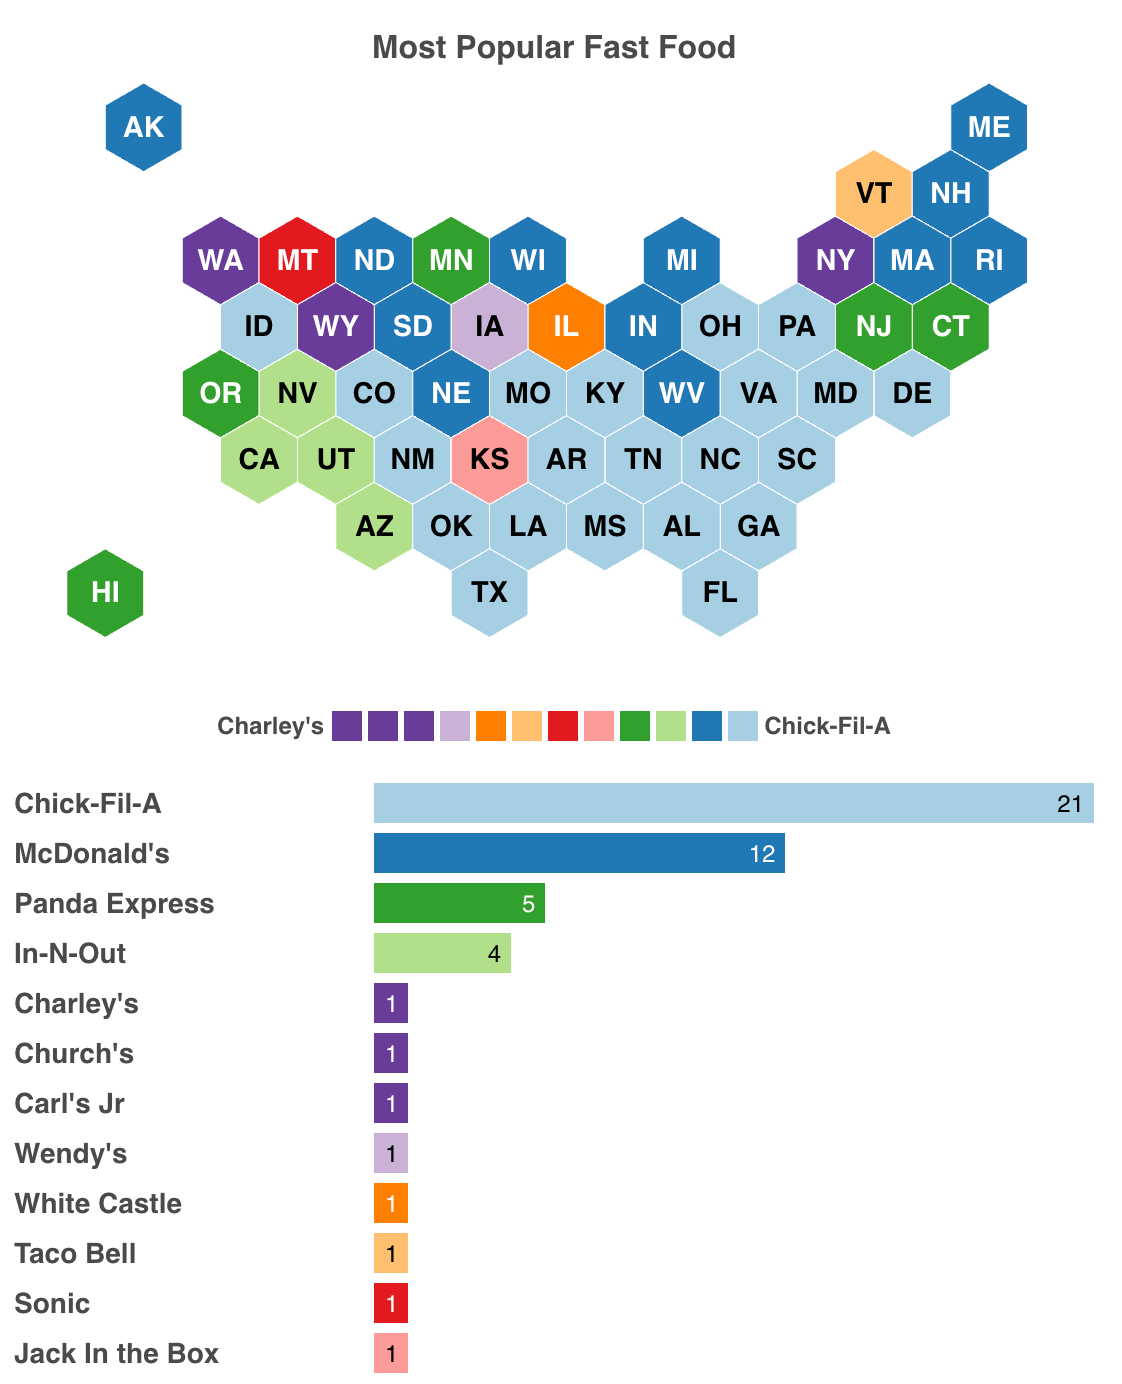
As of today, Wendy’s is most popular in Iowa while Chick-Fil-A, McDonald’s, Panda Express, and In- N -Out have more than a 3% of popularity rate in many states of the United States of America. Moreover, the least popular fast-food restaurants in the US are Jack in the Box, Sonic, Taco Bell, White Castle, Carl’s Jr, Church’s, and Charley’s.
Wendy’s Statistics By Employment
- As stated by Wendy’s Statistics, this fast-food restaurant is female-driven as there are 58.7% of female employees ad 41.3% of male employees.
- The highest number of employees working in the restaurant are white by ethnic background resulting in 64.3%.
- Moreover, irrespective of the position, 52.1% of the employees have high school diplomas, 15.1% have associate degrees, 14.6% employees gained their bachelor's, and 12.9% have diplomas.
- Whereas 4% of employees have received their certificate of completion, 1.1% have their master’s, and only 0.1% have either a doctorate or license.
Conclusion
Looking at Wendy’s Statistics, we can say that Wendy's is yet in the growing phase across the globe. Unlike McDonald’s, Wendy’s is available in limited locations only. But Wendy’s menu items are worth trying. The global fast-food market is valued at $652.73 billion in 2023 and is expected to grow at a CAGR of 6.9% in a similar year.
Remember at the beginning we told you that we had already a bunch of Croissants and Hamburgers from Wendy’s? Our entire office finished eating it and they are finger-licking tasty!
Sources
FAQ.
The minimum financial requirement to obtain franchisee for new single and multi-unit or groups are:
- Minimum liquid assets of at least $500,000 and
The minimum net worth of at least $1,000,000 (this may vary according to international markets).
Baconator, Crispy Chicken Nuggets, Natural Cut Fries, Dave’s Double, and Jr. Bacon Cheeseburger are the top 5 Wendy’s menu items as of 2022.
Yes, you can order online on Doordash, GrubHub, Postmates, and Uber Eats to get home delivery.
Wendy’s delivery within 30 to 40 minutes after accepting the order.

Barry is a lover of everything technology. Figuring out how the software works and creating content to shed more light on the value it offers users is his favorite pastime. When not evaluating apps or programs, he's busy trying out new healthy recipes, doing yoga, meditating, or taking nature walks with his little one.
